Equity Template
Analyst Listings
The following analysts provide coverage for the subject firm as of May 2016:
Primary Input Data
Derived Input Data
| Derived Input | Label |
2015 |
2016 |
Equational Form |
| Net Income | NI |  |
||
| Cash Flow From Equity | CFE |  |
||
| Total Equity | TE |  |
||
| Return on Equity | ROE |  |
||
| Net Investment | NetInv |  |
||
| Investment Rate | IR |  |
||
| Cost of Equity |
COE |  |
||
| Enterprise value |
EVMarket |  |
||
| Long-Run Growth |
g = IR x ROIC |
Long-run growth rates of the income variable are used in the Continuing Value portion of the valuation models. | ||
g = %  GDP GDP |
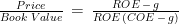
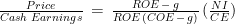
Valuation Multiple Outcomes
The outcomes presented in this study are the result of original input data, derived data, and synthesized inputs.
| Equational Form |
Observed Value |
Single-stage multiple g solution |
Two-stage valuation model g solution |
|||
| 12/31/2015 | 12/31/2016 | 12/31/2015 | 12/31/2016 | 12/31/2015 | 12/31/2016 | |
|
|
||||||
|
|
||||||
|
|
||||||