Abbot Laboratories
Analyst Listing
The following analysts provide coverage for the subject firm as of May 2016:
| Broker | Analyst | Analyst Email |
| BTIG | Dane Leone | dleone@btig.com |
| Leerink Partners | Danielle Antalffy | danielle.antalffy@leerink.com |
| Argus Research | David Toung | dtoung@argusresearch.com |
| Morningstar | Debbie S. Wang | debbie.wang@morningstar.com |
| RBC Capital Markets | Glenn Novarro | glenn.novarro@rbccm.com |
| Erste Group | Hans Engel | hans.engel@erstegroup.com |
| Raymond James | Jayson Bedford | jayson.bedford@raymondjames.com |
| Jefferies | Jeffrey Holford | jholford@jefferies.com |
| Gabelli & Company | Jennie Tsai | jtsai@gabelli.com |
| BMO Capital Markets | Joanne K. Wuensch | joanne.wuensch@bmo.com |
| Cowen & Company | Joshua Jennings | josh.jennings@cowen.com |
| First Global Stockbroking | Kavita Thomas | kavita.thomas@fglobal.com |
| Deutsche Bank Research | Kristen Stewart | kristen.stewart@db.com |
| Wells Fargo Securities | Larry Biegelsen | lawrence.biegelsen@wellsfargo.com |
| William Blair | Margaret Kaczor | mkaczor@williamblair.com |
| Credit Suisse | Matthew Keeler | matthew.keeler@credit-suisse.com |
| Stifel Nicolaus | Rick Wise | wiser@stifel.com |
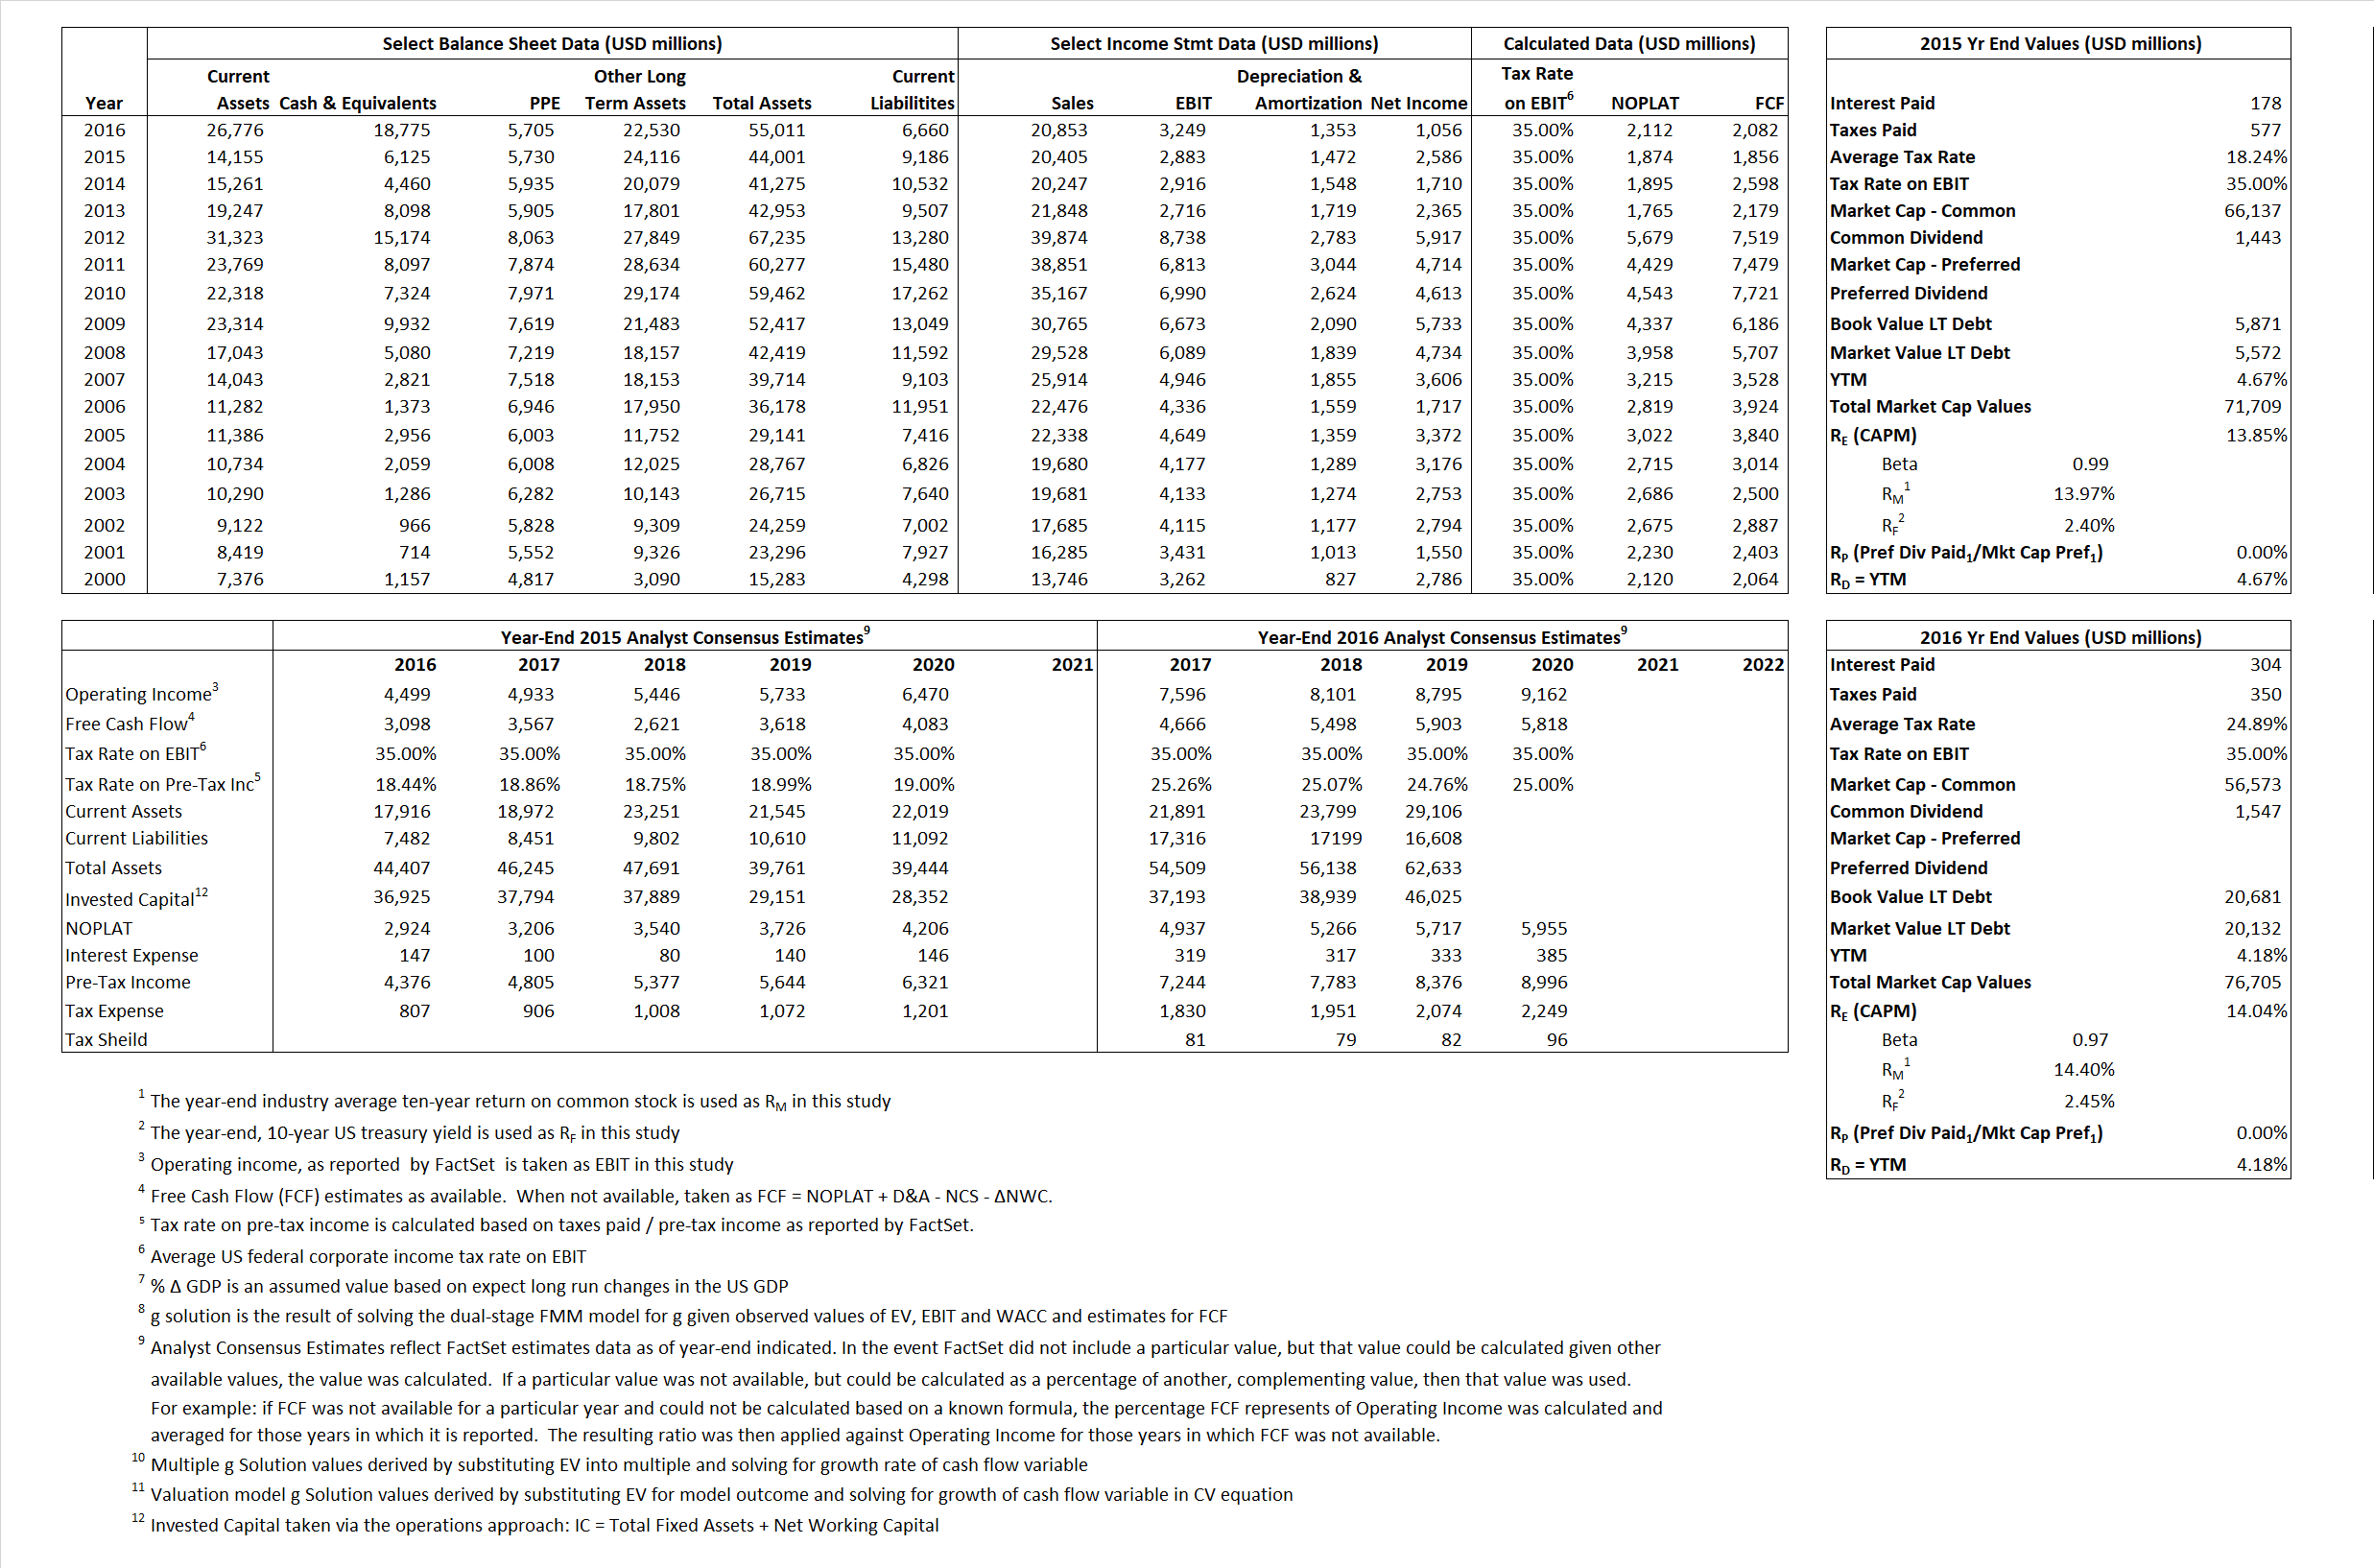
Primary Input Data
Derived Input Data
Derived Input |
Label |
2015 Value |
2016
|
Equational Form |
| Net Operating Profit Less Adjusted Taxes | NOPLAT | 1,874 | 2,112 |  |
| Free Cash Flow | FCF | 1,856 | 2,082 |  |
| Tax Shield | TS | 32 | 76 |  |
| Invested Capital | IC | 34,815 | 48,351 |  |
| Return on Invested Capital | ROIC | 5.38% | 4.37% |  |
| Net Investment | NetInv | 5,544 | 14,889 |  |
| Investment Rate | IR | 295.85% | 705.02% |  |
| Weighted Average Cost of Capital |
WACCMarket | 13.07% | 11.18% |  |
| WACCBook | 8.46% | 6.96% | ||
| Enterprise value |
EVMarket | 65,584 | 57,930 |  |
| EVBook | 65,883 | 58,479 | ||
| Long-Run Growth |
g = IR x ROIC |
15.92% | 30.79% | Long-run growth rates of the income variable are used in the Continuing Value portion of the valuation models. |
g = %  GDP GDP |
2.50% | 2.50% | ||
| Margin from Operations | M | 14.13% | 15.58% |  |
| Depreciation/Amortization Rate | D | 33.80% | 29.40% |  |
Valuation Multiple Outcomes
The outcomes presented in this study are the result of original input data, derived data, and synthesized inputs.
Equational Form |
Observed Value |
Single-stagemultiple g solution |
Two-stage valuationmodel g solution |
|||
| 12/31/2015 | 12/31/2016 | 12/31/2015 | 12/31/2016 | 12/31/2015 | 12/31/2016 | |
|
|
3.21 | 2.78 | 21.78% | 45.57% | 17.22% | 31.70% |
|
|
15.06 | 12.59 | 21.78% | 45.57% | 17.22% | 31.70% |
|
|
35.00 | 27.43 | 21.78% | 45.57% | 17.22% | 31.70% |
|
|
35.34 | 27.82 | 21.78% | 45.57% | 17.22% | 31.70% |
|
|
22.75 | 17.83 | 21.78% | 45.57% | 17.22% | 31.70% |
|
|
1.88 | 1.20 | 21.78% | 45.57% | 17.22% | 31.70% |


