Berkshire Hathaway
Analyst Listing
The following analysts provide coverage for the subject firm as of May 2016:
| Broker | Analyst | Analyst Email |
| Keefe Bruyette & Woods | Meyer Shields | mshields@kbw.com |
Primary Input Data
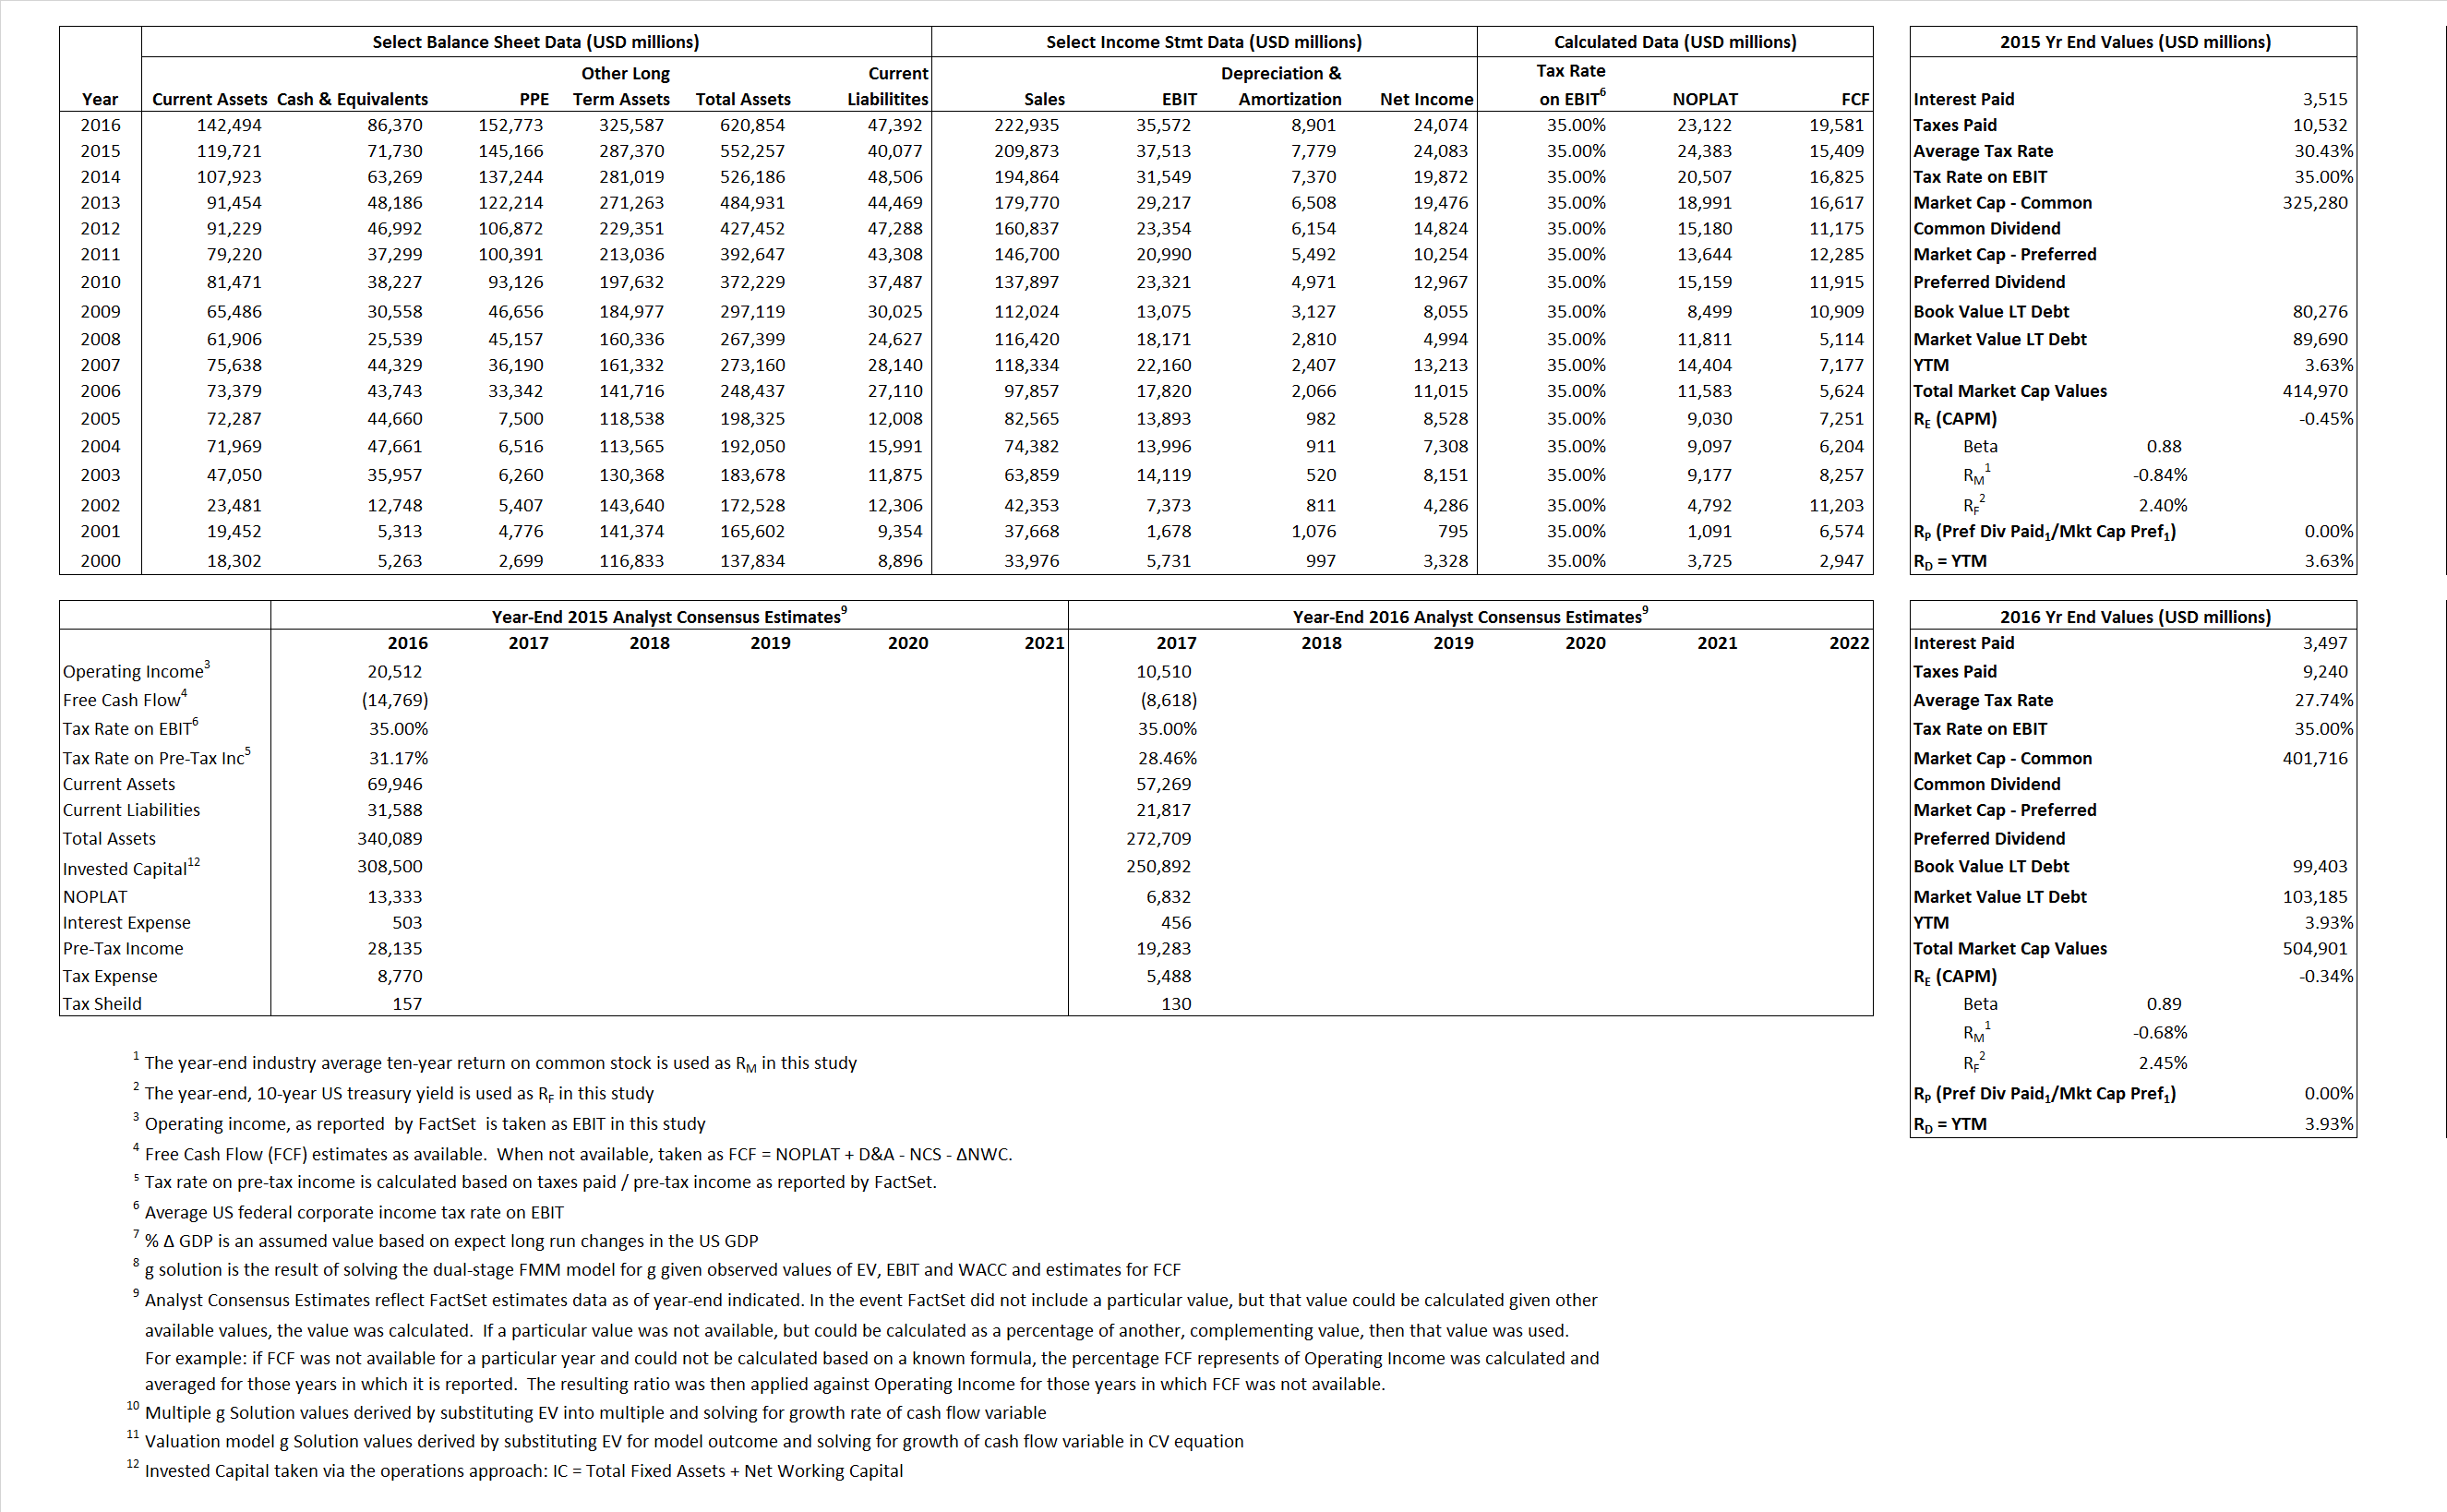
Derived Input Data
Derived Input |
Label |
2015 Value |
2016
|
Equational Form |
| Net Operating Profit Less Adjusted Taxes | NOPLAT | 24,383 | 23,122 |  |
| Free Cash Flow | FCF | 15,409 | 19,581 |  |
| Tax Shield | TS | 1,069 | 970 |  |
| Invested Capital | IC | 512,180 | 573,462 |  |
| Return on Invested Capital | ROIC | 4.76% | 4.03% |  |
| Net Investment | NetInv | 42,279 | 70,183 |  |
| Investment Rate | IR | 173.39% | 303.54% |  |
| Weighted Average Cost of Capital |
WACCMarket | 0.19% | 0.31% |  |
| WACCBook | 7.08% | 6.90% | ||
| Enterprise value |
EVMarket | 343,240 | 418,531 |  |
| EVBook | 333,826 | 414,749 | ||
| Long-Run Growth |
g = IR x ROIC |
8.25% | 12.24% | Long-run growth rates of the income variable are used in the Continuing Value portion of the valuation models. |
g = %  GDP GDP |
2.50% | 2.50% | ||
| Margin from Operations | M | 17.87% | 15.96% |  |
| Depreciation/Amortization Rate | D | 17.18% | 20.01% |  |
Valuation Multiple Outcomes
The outcomes presented in this study are the result of original input data, derived data, and synthesized inputs.
Equational Form |
Observed Value |
Single-stagemultiple g solution |
Two-stage valuationmodel g solution |
|||
| 12/31/2015 | 12/31/2016 | 12/31/2015 | 12/31/2016 | 12/31/2015 | 12/31/2016 | |
|
|
1.64 | 1.88 | 14.04% | 14.08% | 15.43% | 14.19% |
|
|
7.58 | 9.41 | 14.04% | 14.08% | 15.43% | 14.19% |
|
|
14.08 | 18.10 | 14.04% | 14.08% | 15.43% | 14.19% |
|
|
22.28 | 21.37 | 14.04% | 14.08% | 15.43% | 14.19% |
|
|
9.15 | 11.77 | 14.04% | 14.08% | 15.43% | 14.19% |
|
|
0.67 | 0.73 | 14.04% | 14.08% | 15.43% | 14.19% |


