Amgen Inc.
Analyst Listing
The following analysts provide coverage for the subject firm as of May 2016:
| Broker | Analyst | Analyst Email |
| Credit Suisse | Alethia Young | alethia.young@credit-suisse.com |
| Raymond James | Christopher J. Raymond | chris.raymond@raymondjames.com |
| Cowen & Company | Eric Schmidt | eric.schmidt@cowen.com |
| Jefferies | Eun K. Yang | eyang@jefferies.com |
| Leerink Partners | Geoffrey C. Porges | geoffrey.porges@leerink.com |
| BTIG | Hartaj Singh | hsingh@btig.com |
| Wells Fargo Securities | Jim Birchenough | jim.birchenough@wellsfargo.com |
| William Blair | John Sonnier | jsonnier@williamblair.com |
| Piper Jaffray | Joshua Schimmer | joshua.e.schimmer@pjc.com |
| BMO Capital Markets | M. Ian Somaiya | ian.somaiya@bmo.com |
| Evercore ISI | Mark Schoenebaum | mark.schoenebaum@evercoreisi.com |
| RBC Capital Markets | Michael J. Yee | michael.yee@rbccm.com |
| Atlantic Equities | Steve Chesney | s.chesney@atlantic-equities.com |
Primary Input Data
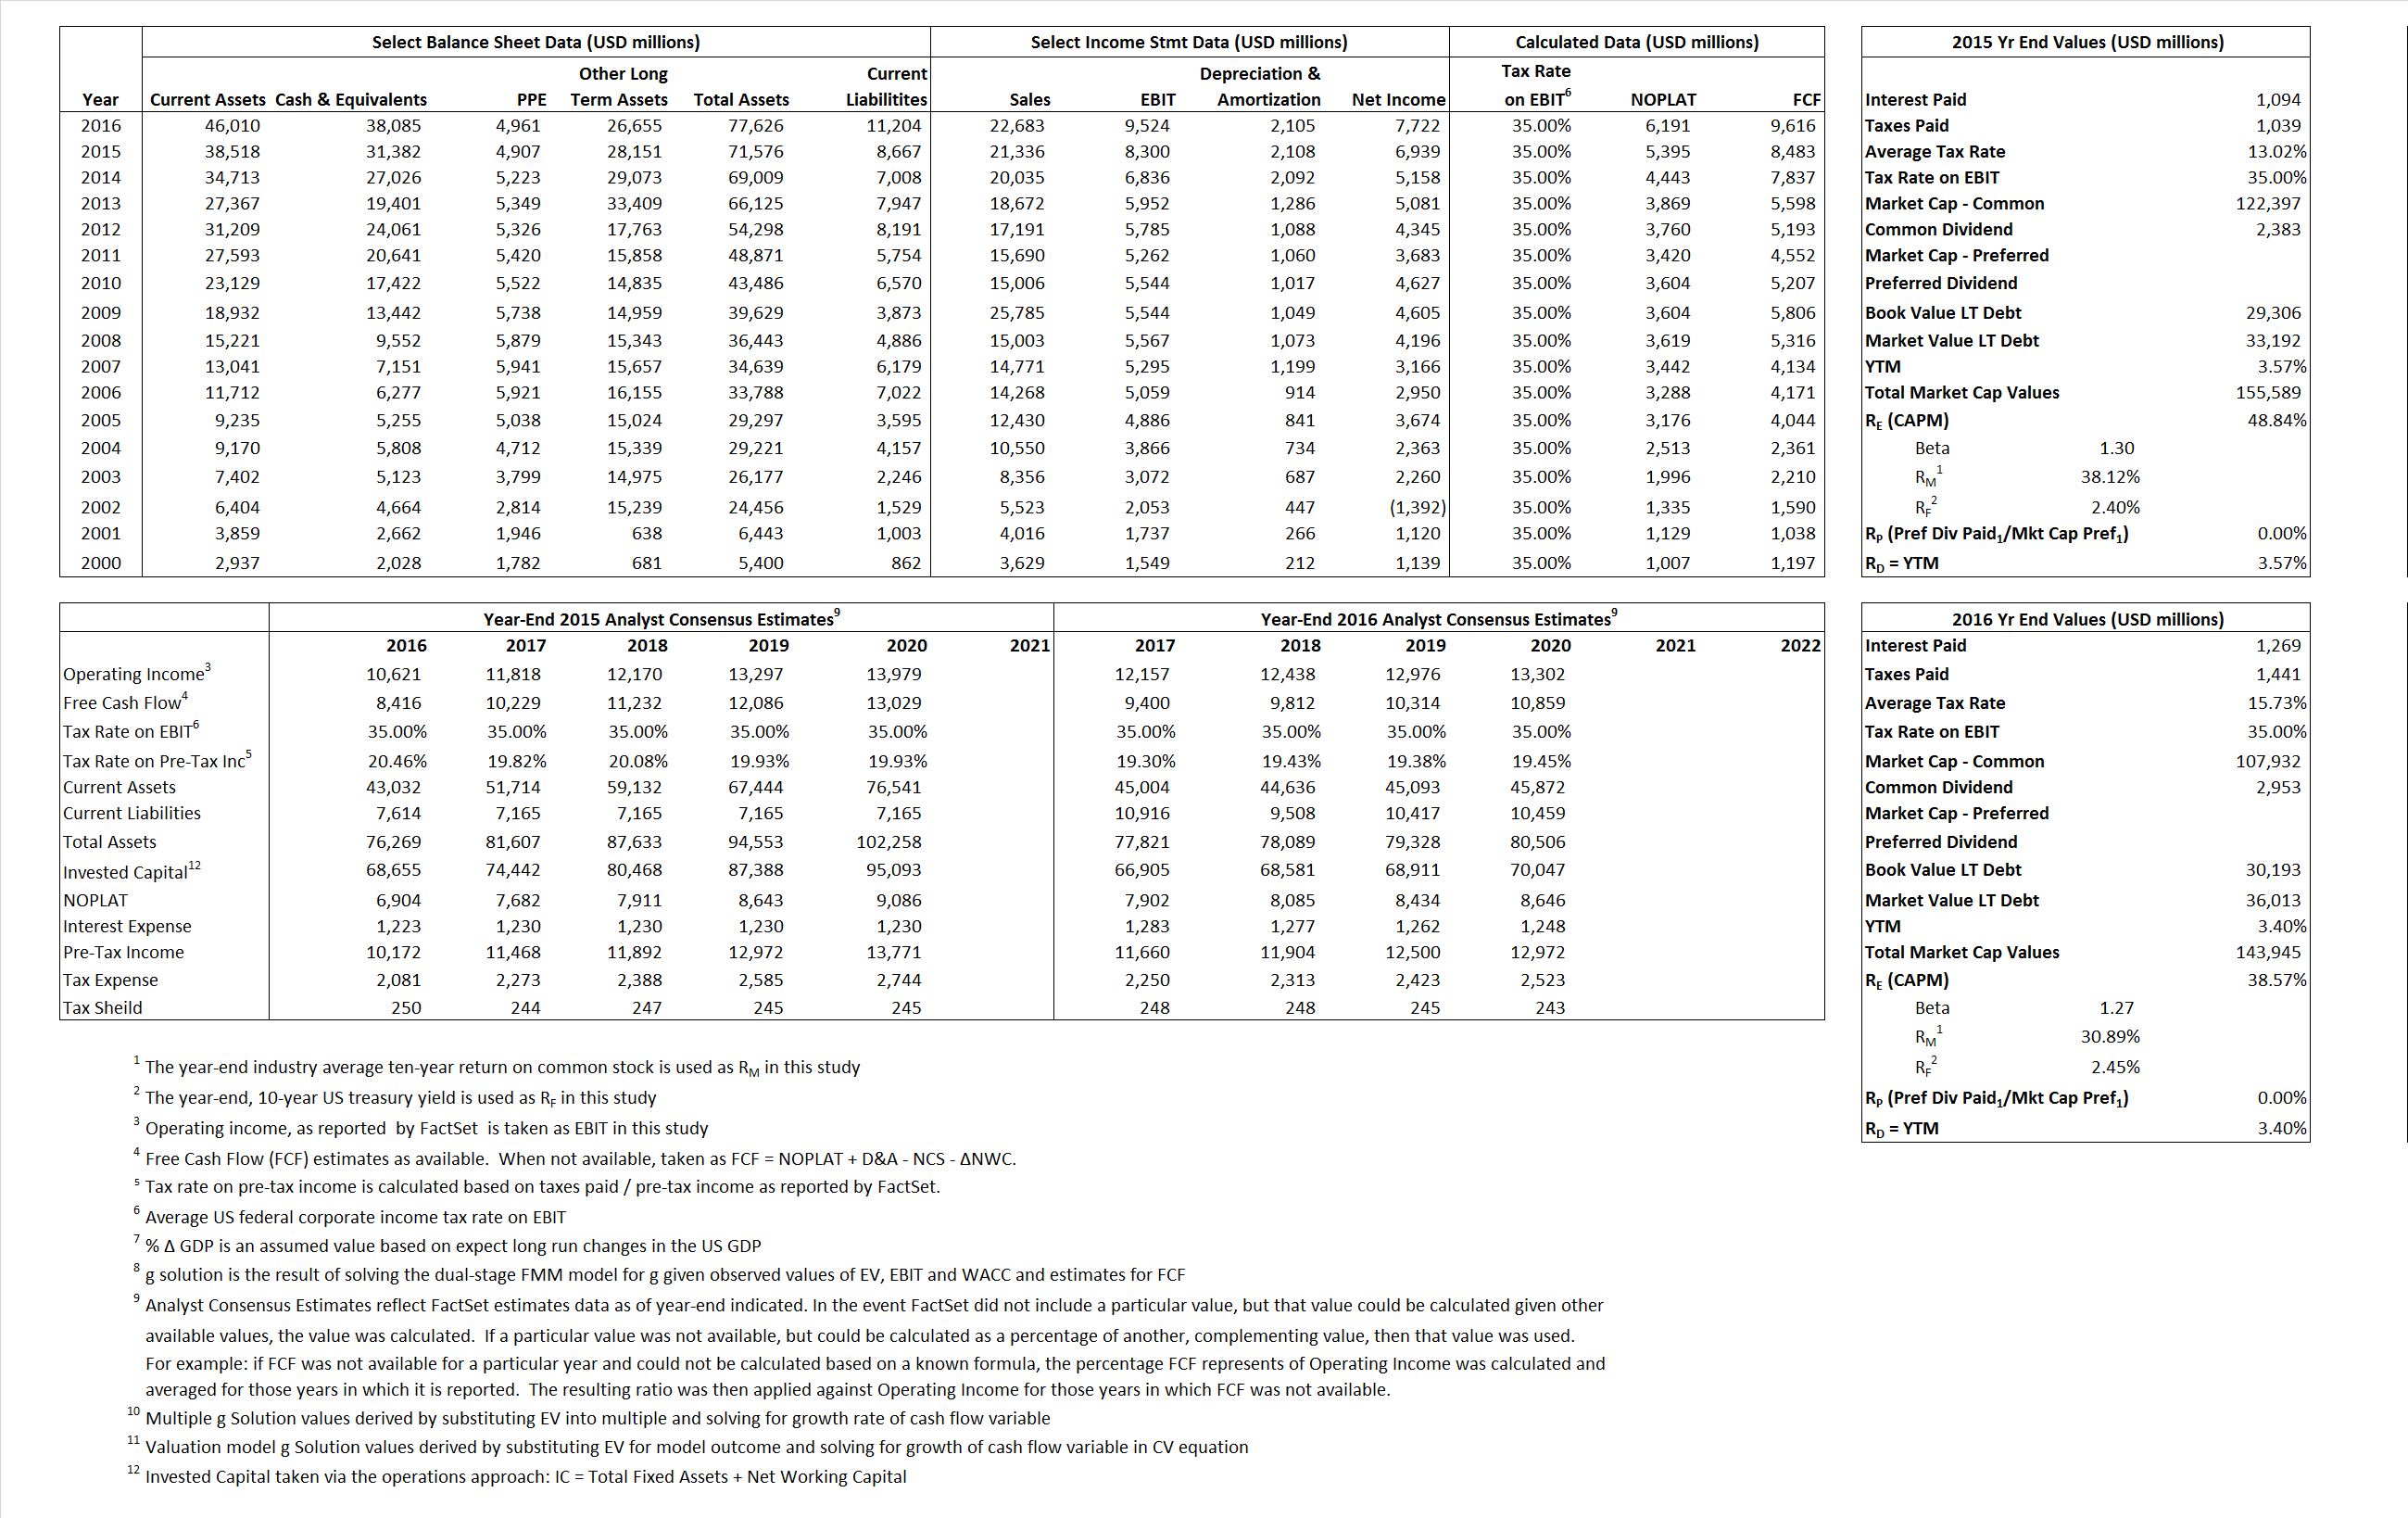
Derived Input Data
Derived Input |
Label |
2015 Value |
2016
|
Equational Form |
| Net Operating Profit Less Adjusted Taxes | NOPLAT | 5,395 | 6,191 |  |
| Free Cash Flow | FCF | 8,483 | 9,616 |  |
| Tax Shield | TS | 142 | 200 |  |
| Invested Capital | IC | 62,909 | 66,422 |  |
| Return on Invested Capital | ROIC | 8.58% | 9.32% |  |
| Net Investment | NetInv | 3,016 | 5,618 |  |
| Investment Rate | IR | 55.90% | 90.75% |  |
| Weighted Average Cost of Capital |
WACCMarket | 39.08% | 29.64% |  |
| WACCBook | 9.71% | 8.73% | ||
| Enterprise value |
EVMarket | 124,207 | 105,860 |  |
| EVBook | 120,321 | 100,040 | ||
| Long-Run Growth |
g = IR x ROIC |
4.79% | 8.46% | Long-run growth rates of the income variable are used in the Continuing Value portion of the valuation models. |
g = %  GDP GDP |
2.50% | 2.50% | ||
| Margin from Operations | M | 38.90% | 41.99% |  |
| Depreciation/Amortization Rate | D | 20.25% | 18.10% |  |
Valuation Multiple Outcomes
The outcomes presented in this study are the result of original input data, derived data, and synthesized inputs.
Equational Form |
Observed Value |
Single-stagemultiple g solution |
Two-stage valuationmodel g solution |
|||
| 12/31/2015 | 12/31/2016 | 12/31/2015 | 12/31/2016 | 12/31/2015 | 12/31/2016 | |
|
|
5.82 | 4.67 | 70.39% | 63.85% | 43.14% | 35.44% |
|
|
11.93 | 9.10 | 70.39% | 63.85% | 43.14% | 35.44% |
|
|
23.02 | 17.10 | 70.39% | 63.85% | 43.14% | 35.44% |
|
|
14.64 | 11.01 | 70.39% | 63.85% | 43.14% | 35.44% |
|
|
14.96 | 11.12 | 70.39% | 63.85% | 43.14% | 35.44% |
|
|
1.97 | 1.59 | 70.39% | 63.85% | 43.14% | 35.44% |


