Boeing
Analyst Listing
The following analysts provide coverage for the subject firm as of May 2016:
The following analysts provide coverage for the subject firm as of May 2016:
| Broker | Analyst | Analyst Email |
| Cowen & Company | Cai von Rumohr | cai.von-rumohr@cowen.com |
| Bernstein Research | Douglas S. Harned | douglas.harned@bernstein.com |
| Jefferies | Howard A. Rubel | hrubel@jefferies.com |
| Wolfe Research | Hunter K. Keay | hkeay@wolferesearch.com |
| Canaccord Genuity | Ken Herbert | kherbert@canaccordgenuity.com |
| Deutsche Bank Research | Myles Walton | myles.walton@db.com |
| CRT Capital Group | Peter Arment | parment@sterneageecrt.com |
| Drexel Hamilton | Peter Skibitski | pskibitski@drexelhamilton.com |
| Buckingham Research | Richard Safran | rsafran@buckresearch.com |
| Credit Suisse | Robert Spingarn | robert.spingarn@credit-suisse.com |
| RBC Capital Markets | Robert Stallard | robert.stallard@rbccm.com |
| Wells Fargo Securities | Sam J. Pearlstein | sam.pearlstein@wellsfargo.com |
Primary Input Data
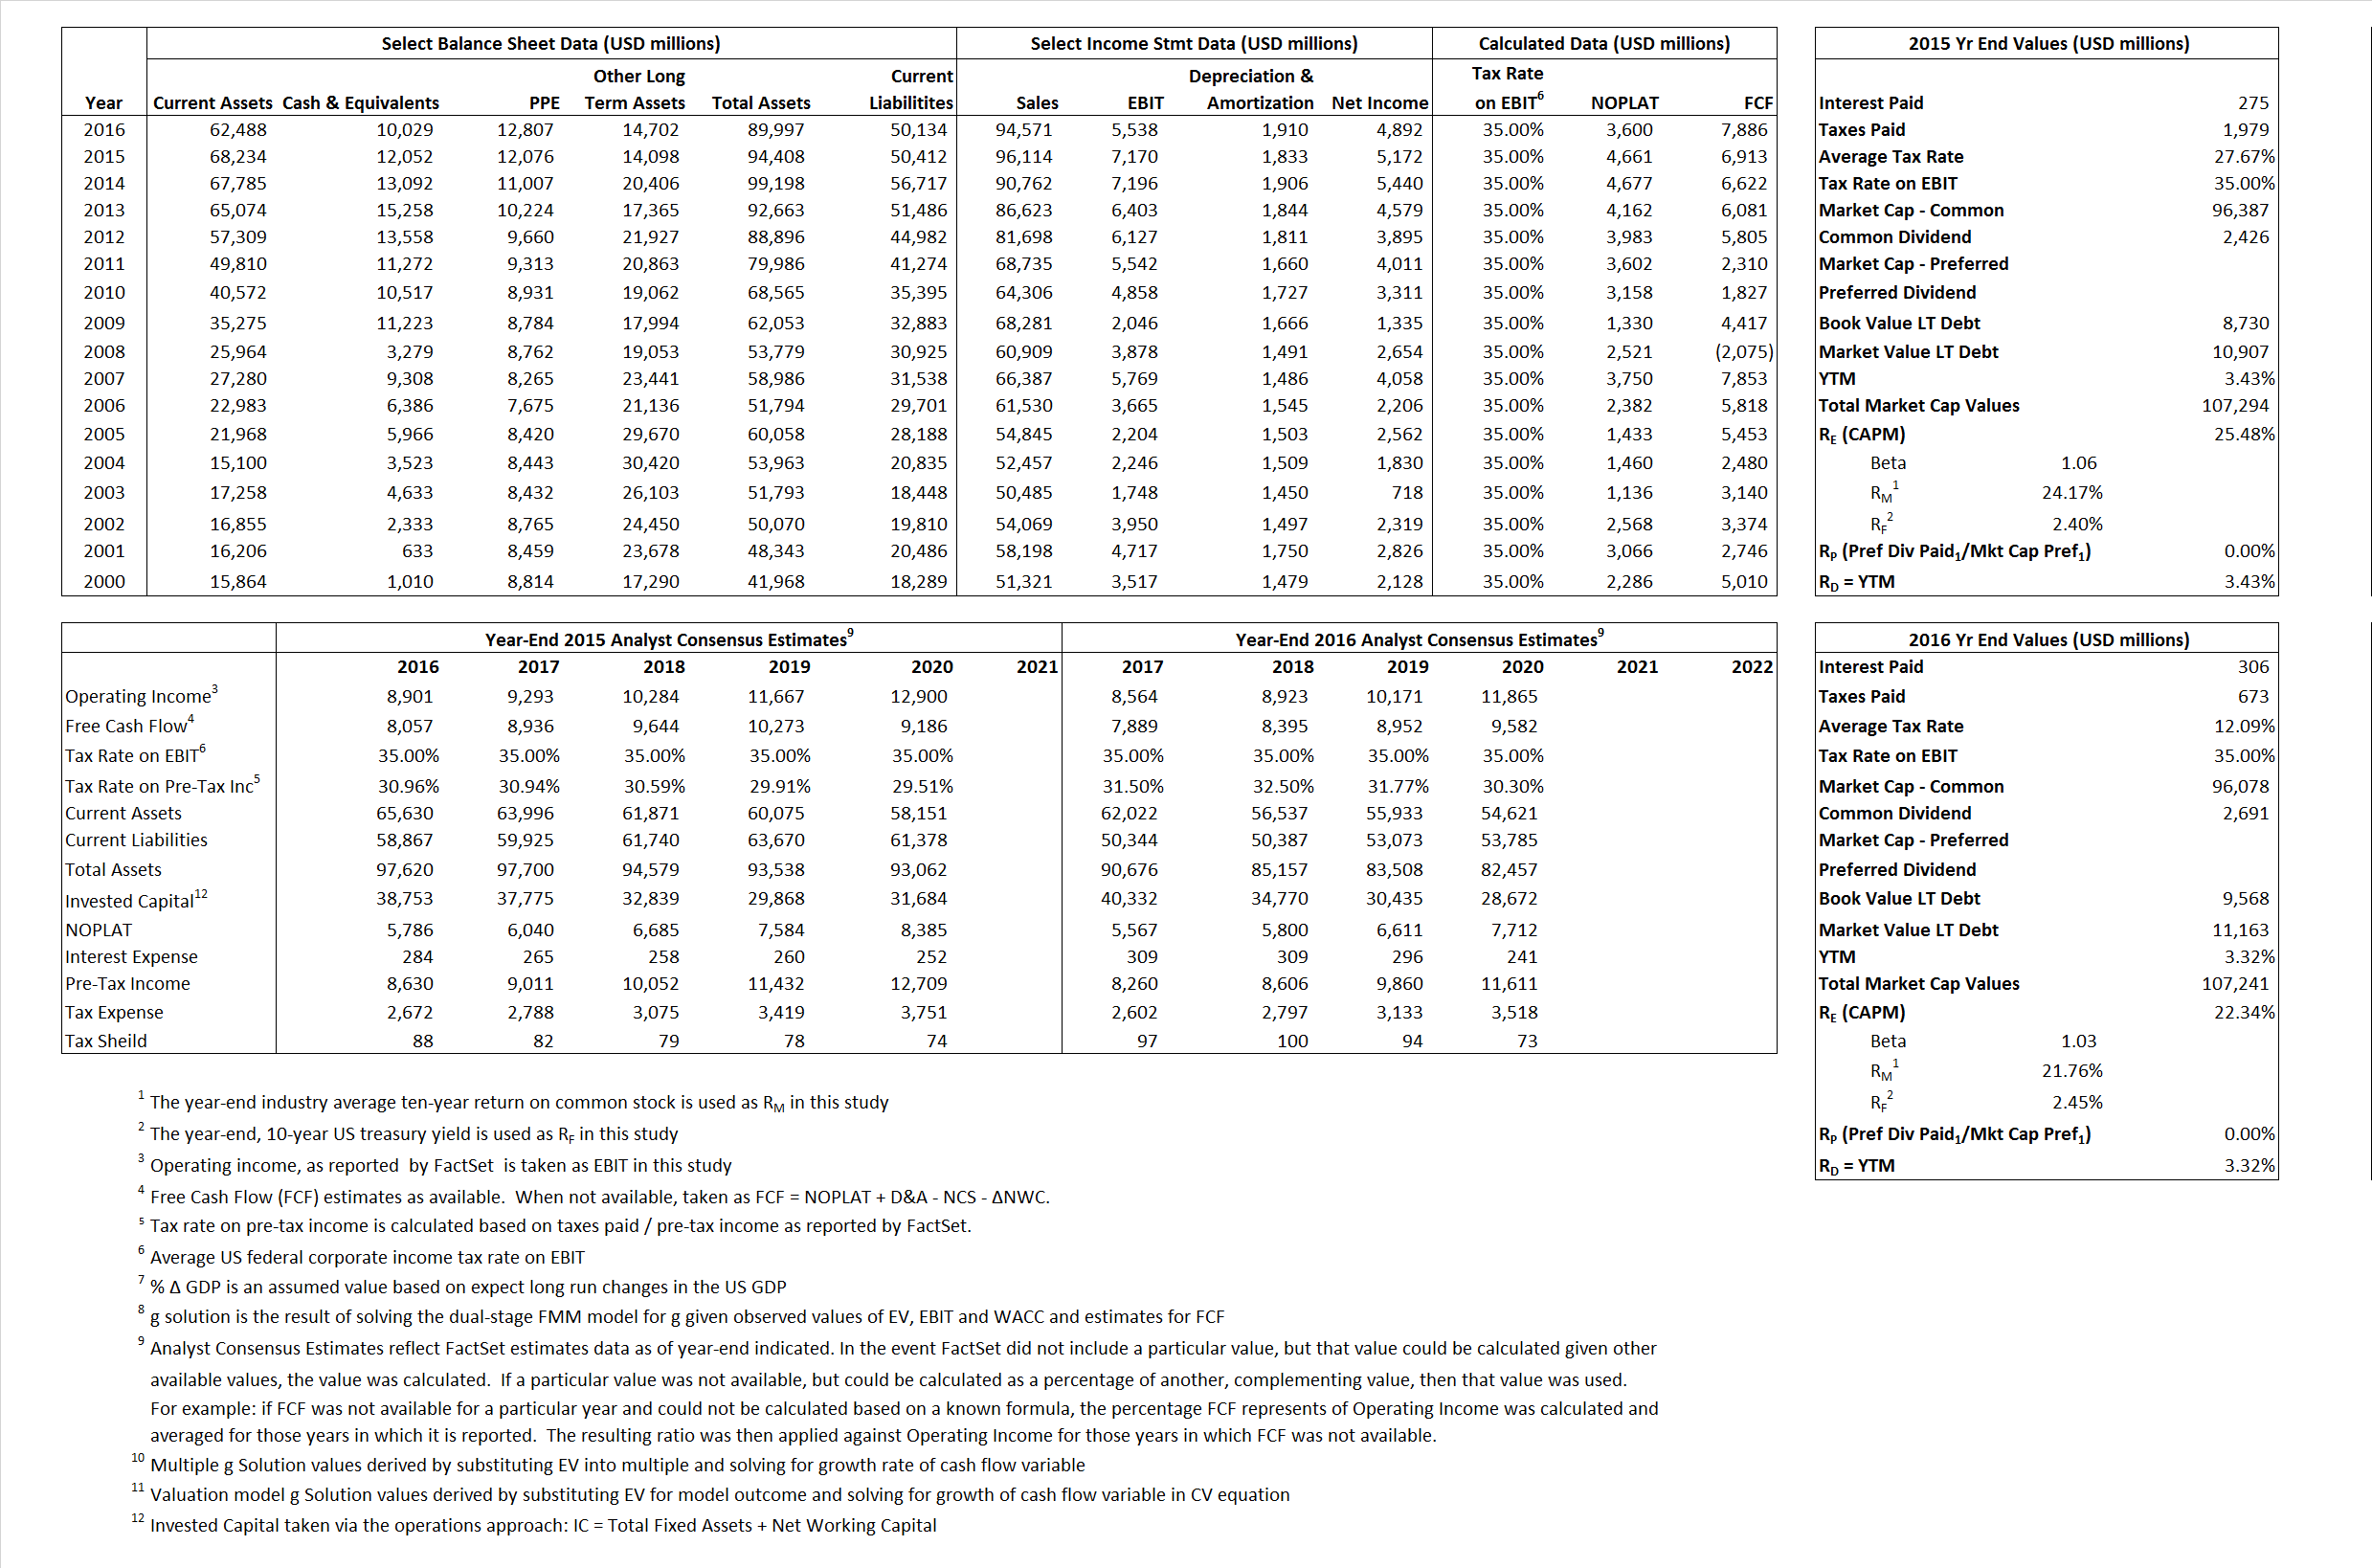
Derived Input Data
Derived Input |
Label |
2015 Value |
2016
|
Equational Form |
| Net Operating Profit Less Adjusted Taxes | NOPLAT | 4,661 | 3,600 |  |
| Free Cash Flow | FCF | 6,913 | 7,886 |  |
| Tax Shield | TS | 76 | 37 |  |
| Invested Capital | IC | 43,996 | 39,863 |  |
| Return on Invested Capital | ROIC | 10.59% | 9.03% |  |
| Net Investment | NetInv | 3,348 | (2,223) |  |
| Investment Rate | IR | 71.84% | -61.76% |  |
| Weighted Average Cost of Capital |
WACCMarket | 23.14% | 20.32% |  |
| WACCBook | 9.07% | 8.54% | ||
| Enterprise value |
EVMarket | 95,242 | 97,212 |  |
| EVBook | 93,065 | 95,617 | ||
| Long-Run Growth |
g = IR x ROIC |
7.61% | -5.58% | Long-run growth rates of the income variable are used in the Continuing Value portion of the valuation models. |
g = %  GDP GDP |
2.50% | 2.50% | ||
| Margin from Operations | M | 7.46% | 5.86% |  |
| Depreciation/Amortization Rate | D | 20.36% | 25.64% |  |
Valuation Multiple Outcomes
The outcomes presented in this study are the result of original input data, derived data, and synthesized inputs.
Equational Form |
Observed Value |
Single-stagemultiple g solution |
Two-stage valuationmodel g solution |
|||
| 12/31/2015 | 12/31/2016 | 12/31/2015 | 12/31/2016 | 12/31/2015 | 12/31/2016 | |
|
|
.99 | 1.03 | 33.91% | 28.16% | 26.72% | 23.06% |
|
|
10.58 | 13.05 | 33.91% | 28.16% | 26.72% | 23.06% |
|
|
20.44 | 27.01 | 33.91% | 28.16% | 26.72% | 23.06% |
|
|
13.78 | 12.33 | 33.91% | 28.16% | 26.72% | 23.06% |
|
|
13.28 | 17.55 | 33.91% | 28.16% | 26.72% | 23.06% |
|
|
2.16 | 2.44 | 33.91% | 28.16% | 26.72% | 23.06% |


