Simon Property Group Inc.
Analyst Listing
The following analysts provide coverage for the subject firm as of May 2016:
| Broker | Analyst | Analyst Email |
| Boenning & Scattergood | Floris Van Dijkum | fvandijkum@boenninginc.com |
| SunTrust Robinson Humphrey | Ki Bin Kim | kibin.kim@suntrust.com |
| Jefferies | Omotayo Okusanya | tokusanya@jefferies.com |
| Canaccord Genuity | Paul Morgan | pmorgan@canaccordgenuity.com |
| RBC Capital Markets | Rich C. Moore | rich.moore@rbccm.com |
| Evercore ISI | Steve Sakwa | steve.sakwa@evercoreisi.com |
| Deutsche Bank Research | Vin Chao | vincent.chao@db.com |
Primary Input Data
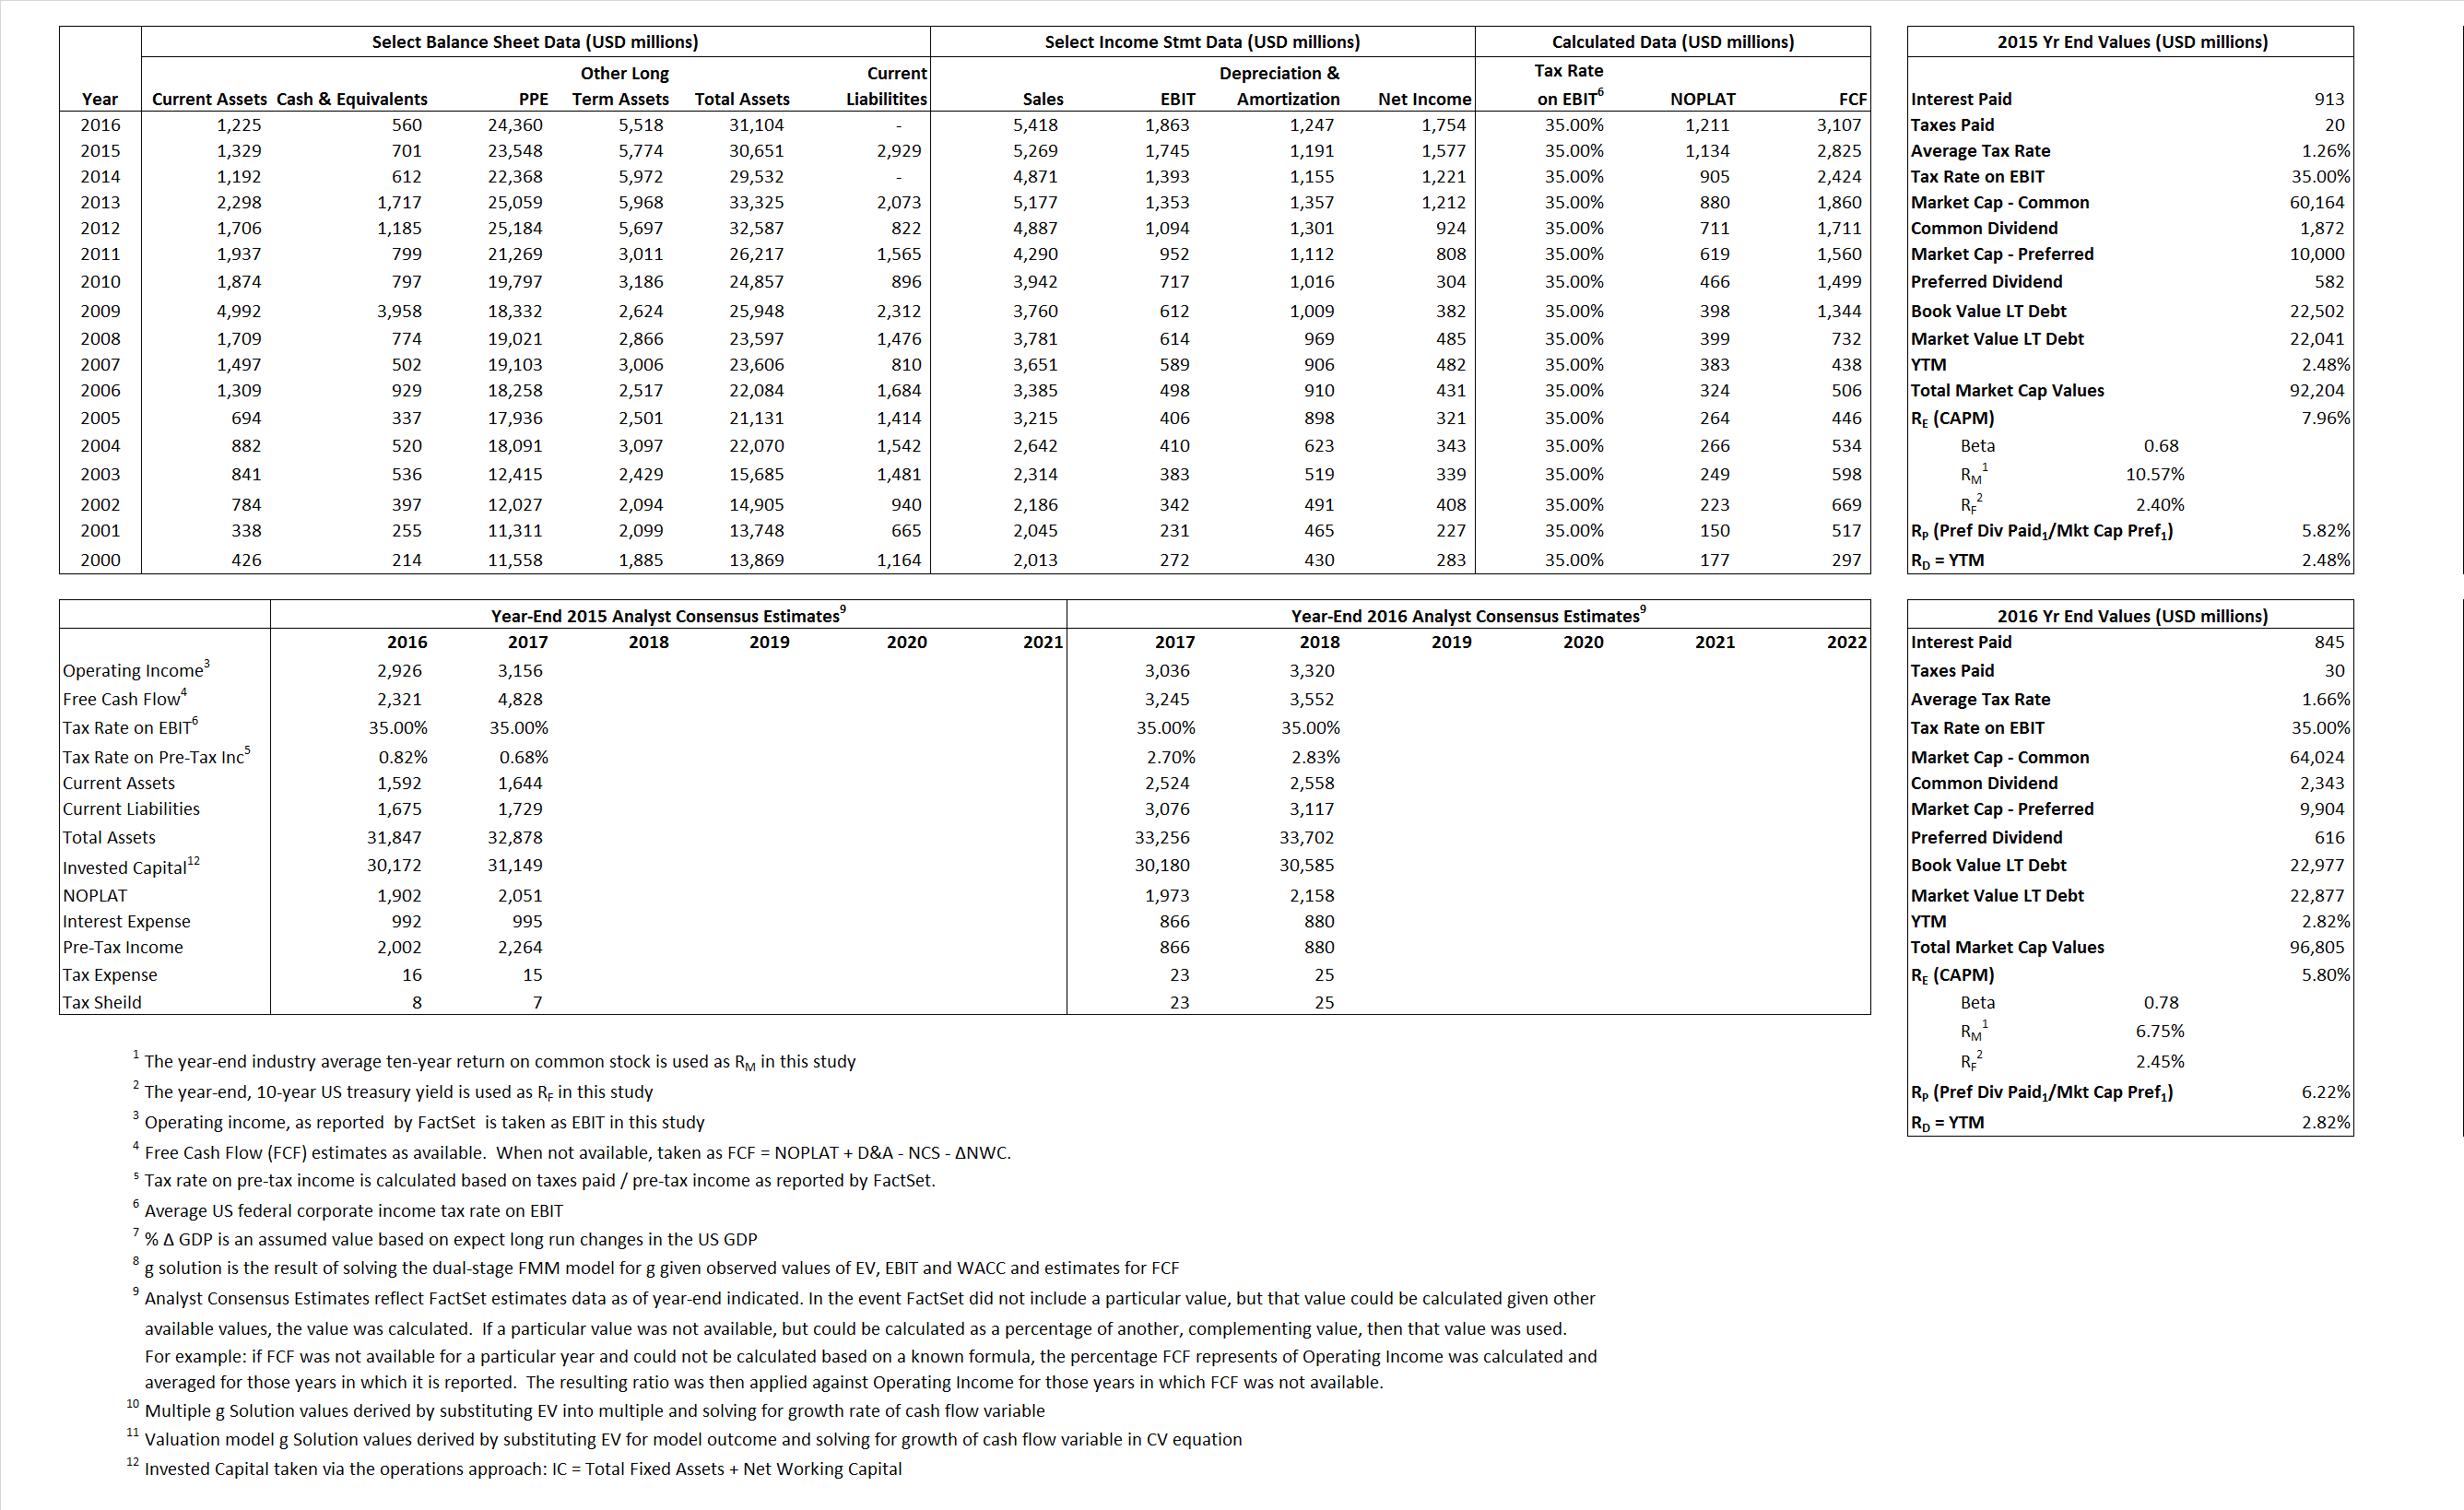
Derived Input Data
Derived Input |
Label |
2015 Value |
2016
|
Equational Form |
| Net Operating Profit Less Adjusted Taxes | NOPLAT | 1,134 | 1,211 |  |
| Free Cash Flow | FCF | 2,825 | 3,107 |  |
| Tax Shield | TS | 12 | 14 |  |
| Invested Capital | IC | 27,722 | 31,104 |  |
| Return on Invested Capital | ROIC | 4.09% | 3.89% |  |
| Net Investment | NetInv | (619) | 4,629 |  |
| Investment Rate | IR | -54.57% | 382.18% |  |
| Weighted Average Cost of Capital |
WACCMarket | 6.41% | 5.13% |  |
| WACCBook | 5.69% | 0.78% | ||
| Enterprise value |
EVMarket | 91,503 | 96,245 |  |
| EVBook | 92,106 | 96,345 | ||
| Long-Run Growth |
g = IR x ROIC |
-2.23% | 14.88% | Long-run growth rates of the income variable are used in the Continuing Value portion of the valuation models. |
g = %  GDP GDP |
2.50% | 2.50% | ||
| Margin from Operations | M | 33.12% | 34.39% |  |
| Depreciation/Amortization Rate | D | 40.57% | 40.10% |  |
Valuation Multiple Outcomes
The outcomes presented in this study are the result of original input data, derived data, and synthesized inputs.
Equational Form |
Observed Value |
Single-stagemultiple g solution |
Two-stage valuationmodel g solution |
|||
| 12/31/2015 | 12/31/2016 | 12/31/2015 | 12/31/2016 | 12/31/2015 | 12/31/2016 | |
|
|
17 | 17.77 | 7.41% | 5.72% | 7.34% | 5.64% |
|
|
.37 | 30.94 | 7.41% | 5.72% | 7.34% | 5.64% |
|
|
31.16 | 79.47 | 7.41% | 5.72% | 7.34% | 5.64% |
|
|
80.66 | 30.97 | 7.41% | 5.72% | 7.34% | 5.64% |
|
|
32.39 | 51.65 | 7.41% | 5.72% | 7.34% | 5.64% |
|
|
3.30 | 3.09 | 7.41% | 5.72% | 7.34% | 5.64% |


