Celgene Corp
Analyst Listing
The following analysts provide coverage for the subject firm as of May 2016:
Primary Input Data
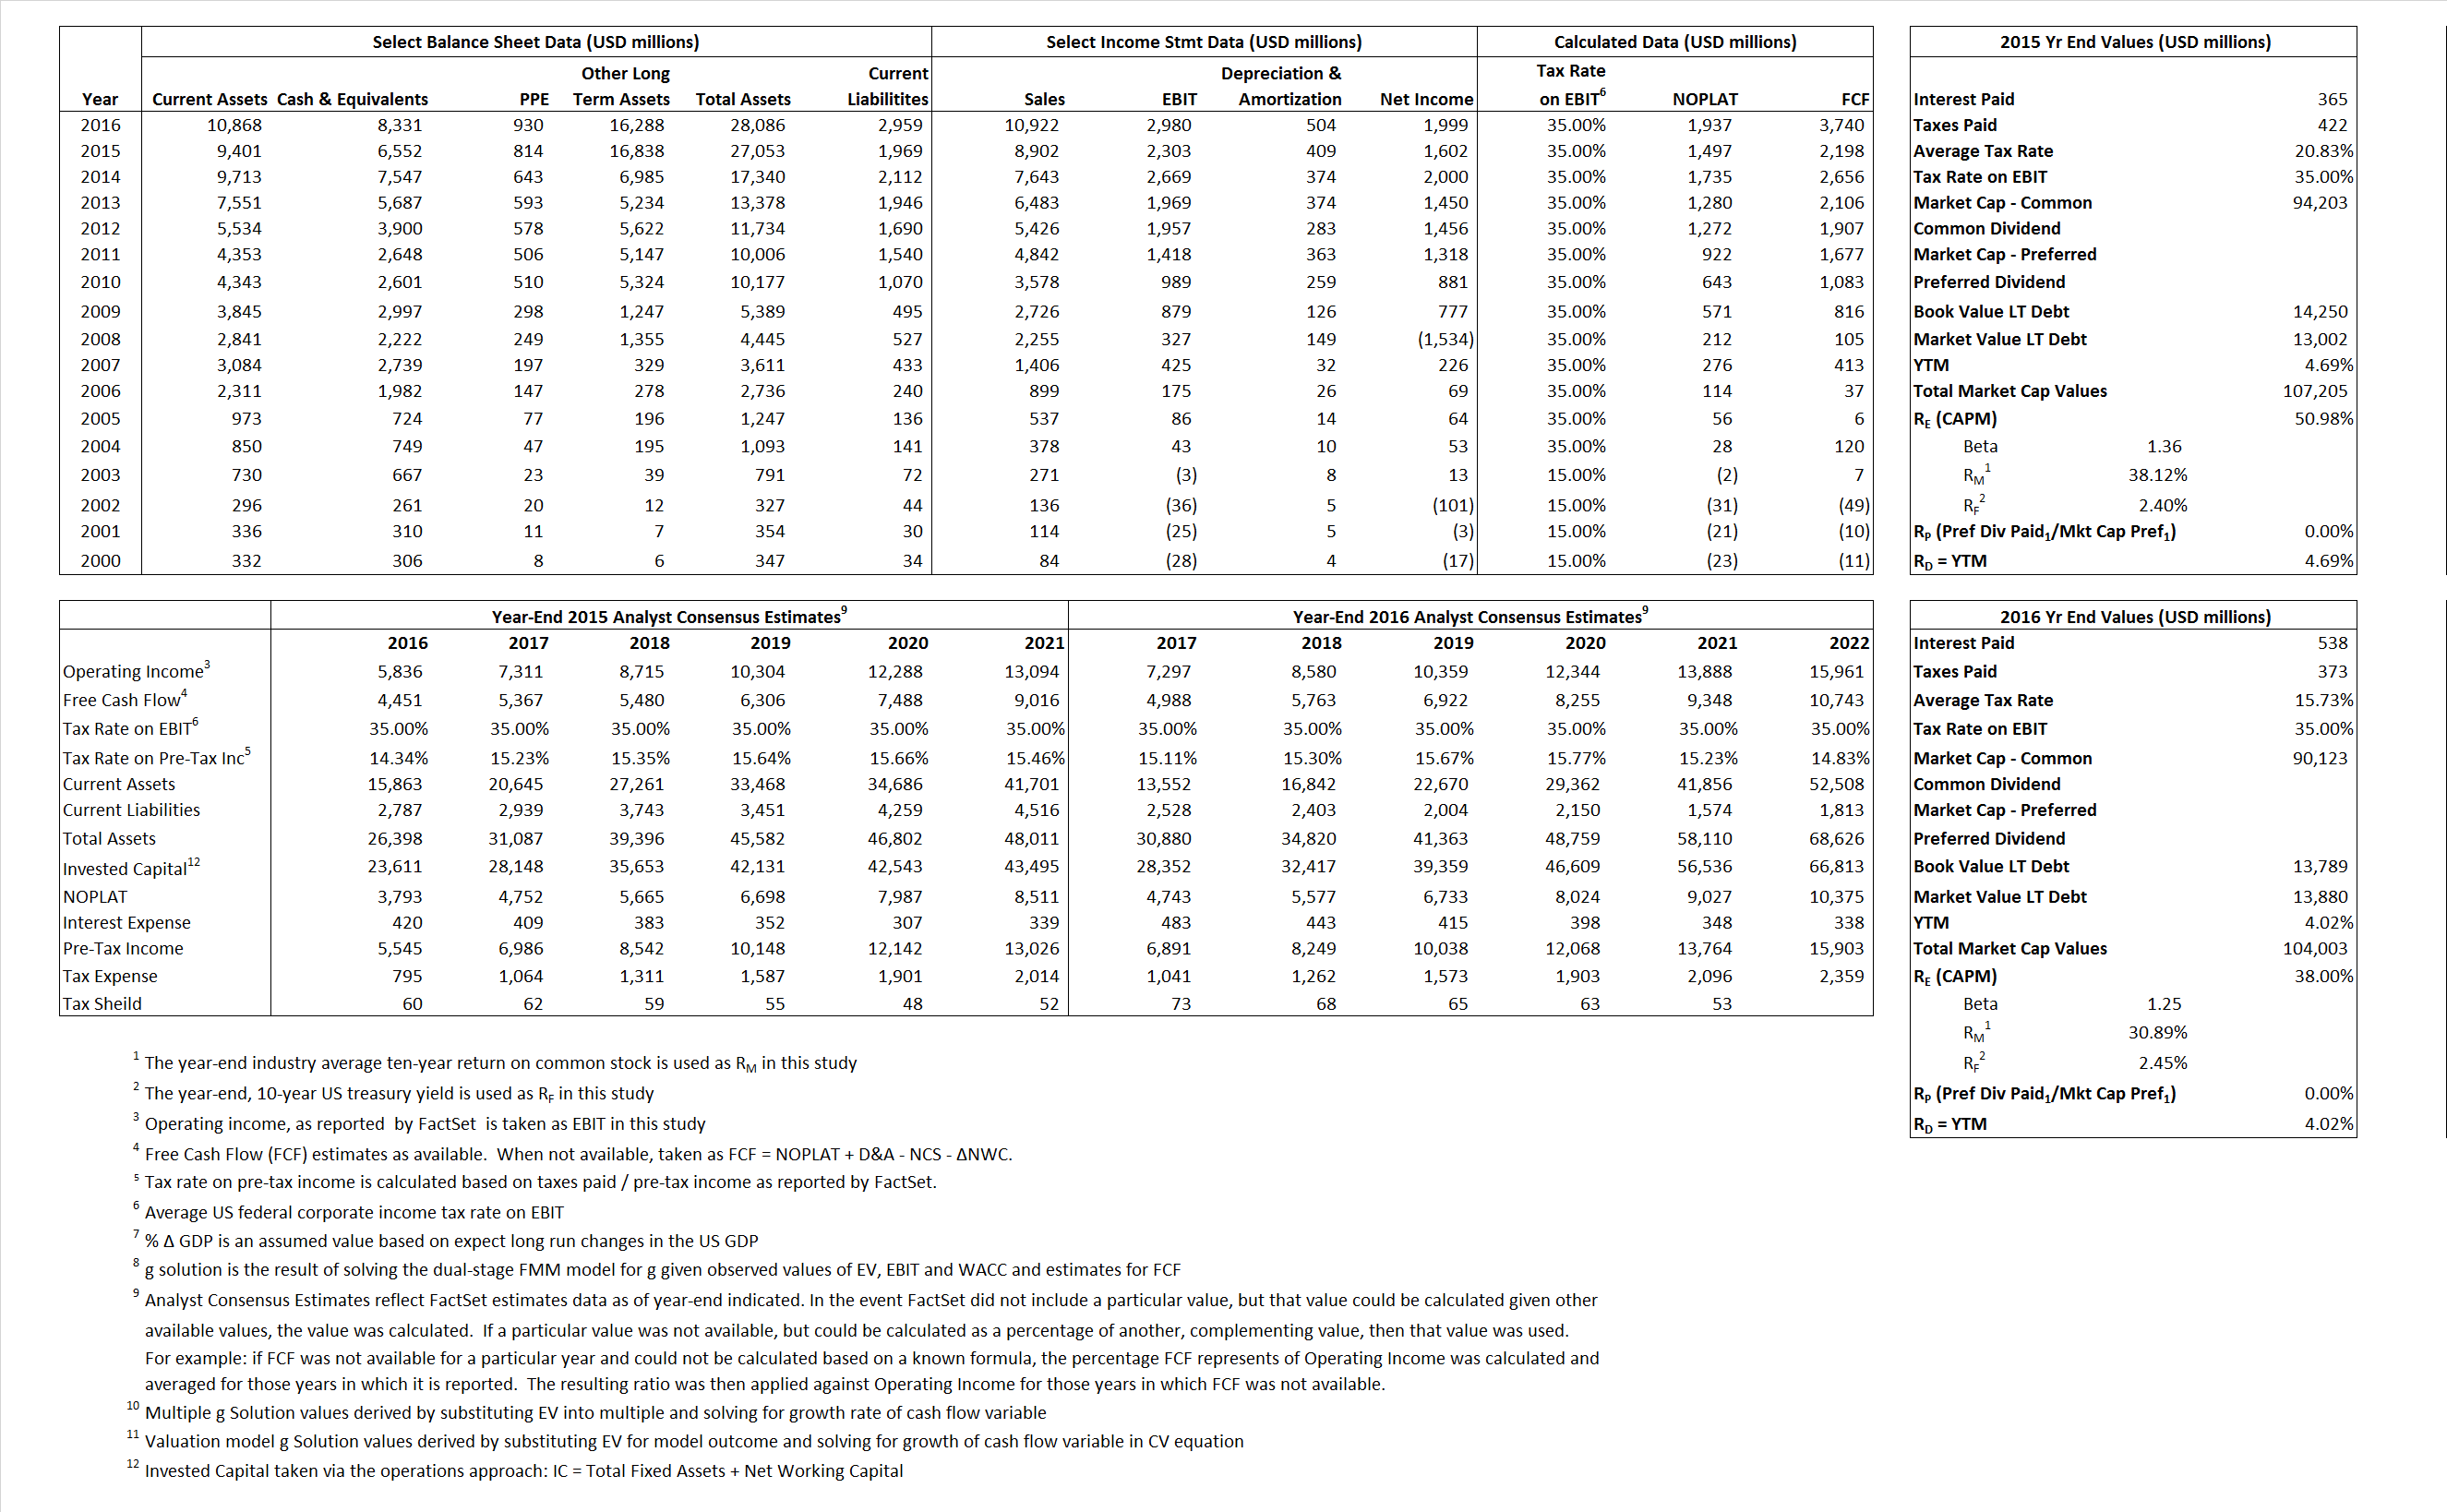
Derived Input Data
Derived Input |
Label |
2015 Value |
2016
|
Equational Form |
| Net Operating Profit Less Adjusted Taxes | NOPLAT | 1,497 | 1,937 |  |
| Free Cash Flow | FCF | 2,198 | 3,740 |  |
| Tax Shield | TS | 76 | 85 |  |
| Invested Capital | IC | 25,085 | 25,126 |  |
| Return on Invested Capital | ROIC | 5.97% | 7.71% |  |
| Net Investment | NetInv | 10,266 | 546 |  |
| Investment Rate | IR | 685.64% | 28.18% |  |
| Weighted Average Cost of Capital |
WACCMarket | 42.25% | 33.38% |  |
| WACCBook | 10.75% | 9.56% | ||
| Enterprise value |
EVMarket | 100,653 | 95,672 |  |
| EVBook | 101,901 | 95,581 | ||
| Long-Run Growth |
g = IR x ROIC |
40.92% | 2.17% | Long-run growth rates of the income variable are used in the Continuing Value portion of the valuation models. |
g = %  GDP GDP |
2.50% | 2.50% | ||
| Margin from Operations | M | 25.88% | 27.28% |  |
| Depreciation/Amortization Rate | D | 15.08% | 14.47% |  |
Valuation Multiple Outcomes
The outcomes presented in this study are the result of original input data, derived data, and synthesized inputs.
Equational Form |
Observed Value |
Single-stagemultiple g solution |
Two-stage valuationmodel g solution |
|||
| 12/31/2015 | 12/31/2016 | 12/31/2015 | 12/31/2016 | 12/31/2015 | 12/31/2016 | |
|
|
11.31 | 8.76 | 58.29% | 42.52% | 47.00% | 35.08% |
|
|
37.11 | 27.46 | 58.29% | 42.52% | 47.00% | 35.08% |
|
|
67.23 | 49.39 | 58.29% | 42.52% | 47.00% | 35.08% |
|
|
45.80 | 25.58 | 58.29% | 42.52% | 47.00% | 35.08% |
|
|
43.70 | 32.10 | 58.29% | 42.52% | 47.00% | 35.08% |
|
|
4.01 | 3.81 | 58.29% | 42.52% | 47.00% | 35.08% |


