American Express
Analyst Listings
The following analysts provide coverage for the subject firm as of May 2016:
| Broker | Analyst | Analyst Email |
| DA Davidson | Arren Cyganovich | acyganovich@dadco.com |
| Oppenheimer | Ben Chittenden | benjamin.chittenden@opco.com |
| Nomura Research | Bill Carcache | bill.carcache@nomura.com |
| Stifel Nicolaus | Christopher C. Brendler | ccbrendler@stifel.com |
| Sandler O’Neill & Partners | Christopher R. Donat | cdonat@sandleroneill.com |
| Drexel Hamilton | David Hilder | dhilder@drexelhamilton.com |
| Deutsche Bank Research | David Ho | david.ho@db.com |
| JMP Securities | David M. Scharf | dscharf@jmpsecurities.com |
| Evercore ISI | David Togut | david.togut@evercoreisi.com |
| Guggenheim Securities | Eric Wasserstrom | eric.wasserstrom@guggenheimpartners.com |
| BMO Capital Markets | James Fotheringham | james.fotheringham@bmo.com |
| Susquehanna Financial Group | James Friedman | james.friedman@sig.com |
| RBC Capital Markets | Jason Arnold | jason.arnold@rbccm.com |
| Piper Jaffray | Jason Deleeuw | jason.s.deleeuw@pjc.com |
| Wells Fargo Securities | Jason Harbes | jason.harbes@wellsfargo.com |
| Jefferies | John Hecht | jhecht@jefferies.com |
| Compass Point Research | John T. Williams | jwilliams@compasspointllc.com |
| Pacific Crest Securities-KBCM | Josh Beck | jbeck@pacific-crest.com |
| Bernstein Research | Kevin St. Pierre | kevin.st-pierre@bernstein.com |
| Credit Suisse | Moshe Orenbuch | moshe.orenbuch@credit-suisse.com |
| Keefe Bruyette & Woods | Sanjay Sakhrani | ssakhrani@kbw.com |
Primary Input Data
Derived Input Data
| Derived Input | Label |
2015 |
2016 |
Equational Form |
| Net Income | NI | 5,125 | 5,365 |  |
| Cash Flow From Equity | CFE | 5,125 | 5,537 |  |
| Total Equity | TE | 20,673 | 20,501 |  |
| Return on Equity | ROE | 24.79% | 26.17% |  |
| Net Investment | NetInv | – | (172) |  |
| Investment Rate | IR | 0.00% | -3.21% |  |
| Cost of Equity |
COE | 0.84% | -0.62% |  |
| Enterprise value |
EVMarket | 44,673 | 41,875 |  |
| Long-Run Growth |
g = IR x ROIC |
0.00% | -0.84% | Long-run growth rates of the income variable are used in the Continuing Value portion of the valuation models. |
g = %  GDP GDP |
2.50% | 2.50% |
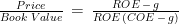
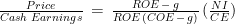
Valuation Multiple Outcomes
The outcomes presented in this study are the result of original input data, derived data, and synthesized inputs.
| Equational Form |
Observed Value |
Single-stage multiple g solution |
Two-stage valuation model g solution |
|||
| 12/31/2015 | 12/31/2016 | 12/31/2015 | 12/31/2016 | 12/31/2015 | 12/31/2016 | |
|
|
||||||
|
|
||||||
|
|
||||||