Apache Corp.
Analyst Listing
The following analysts provide coverage for the subject firm as of May 2016:
| Broker | Analyst | Analyst Email |
| Wells Fargo Securities | David Tameron | david.tameron@wellsfargo.com |
| BMO Capital Markets | Phillip Jungwirth | phillip.jungwirth@bmo.com |
| Johnson Rice & Company | Charles Meade | cmeade@jrco.com |
| Evercore ISI | Stephen Richardson | stephen.richardson@evercoreisi.com |
| Scotia Howard Weil | Peter Kissel | peter.kissel@scotiabank.com |
| Raymond James | John Freeman | john.freeman@raymondjames.com |
| Deutsche Bank Research | Ryan Todd | ryan.todd@db.com |
| Wolfe Research | Paul Sankey | psankey@wolferesearch.com |
| RBC Capital Markets | Scott Hanold | scott.hanold@rbccm.com |
| Atlantic Equities | Barry MacCarthy | b.maccarthy@atlantic-equities.com |
| Capital One Securities | Richard Tullis | richard.tullis@capitalone.com |
| Credit Suisse | Edward Westlake | edward.westlake@credit-suisse.com |
| Piper Jaffray | Pearce Hammond | pearce.w.hammond@simmonspjc.com |
| Alembic Global Advisors | James Sullivan | james.sullivan@alembicglobal.com |
| IBERIA Capital Partners | Eric Fox | eric.fox@iberiabank.com |
| Cowen & Company | Charles Robertson | charles.robertson@cowen.com |
| Jefferies | Jonathan D. Wolff | jwolff@jefferies.com |
| Nomura Research | Lloyd Byrne | lloyd.byrne@nomura.com |
| Seaport Global Securities | Michael Kelly | mkelly@seaportglobal.com |
| KLR Group | Gail Nicholson | gn@klrgroup.com |
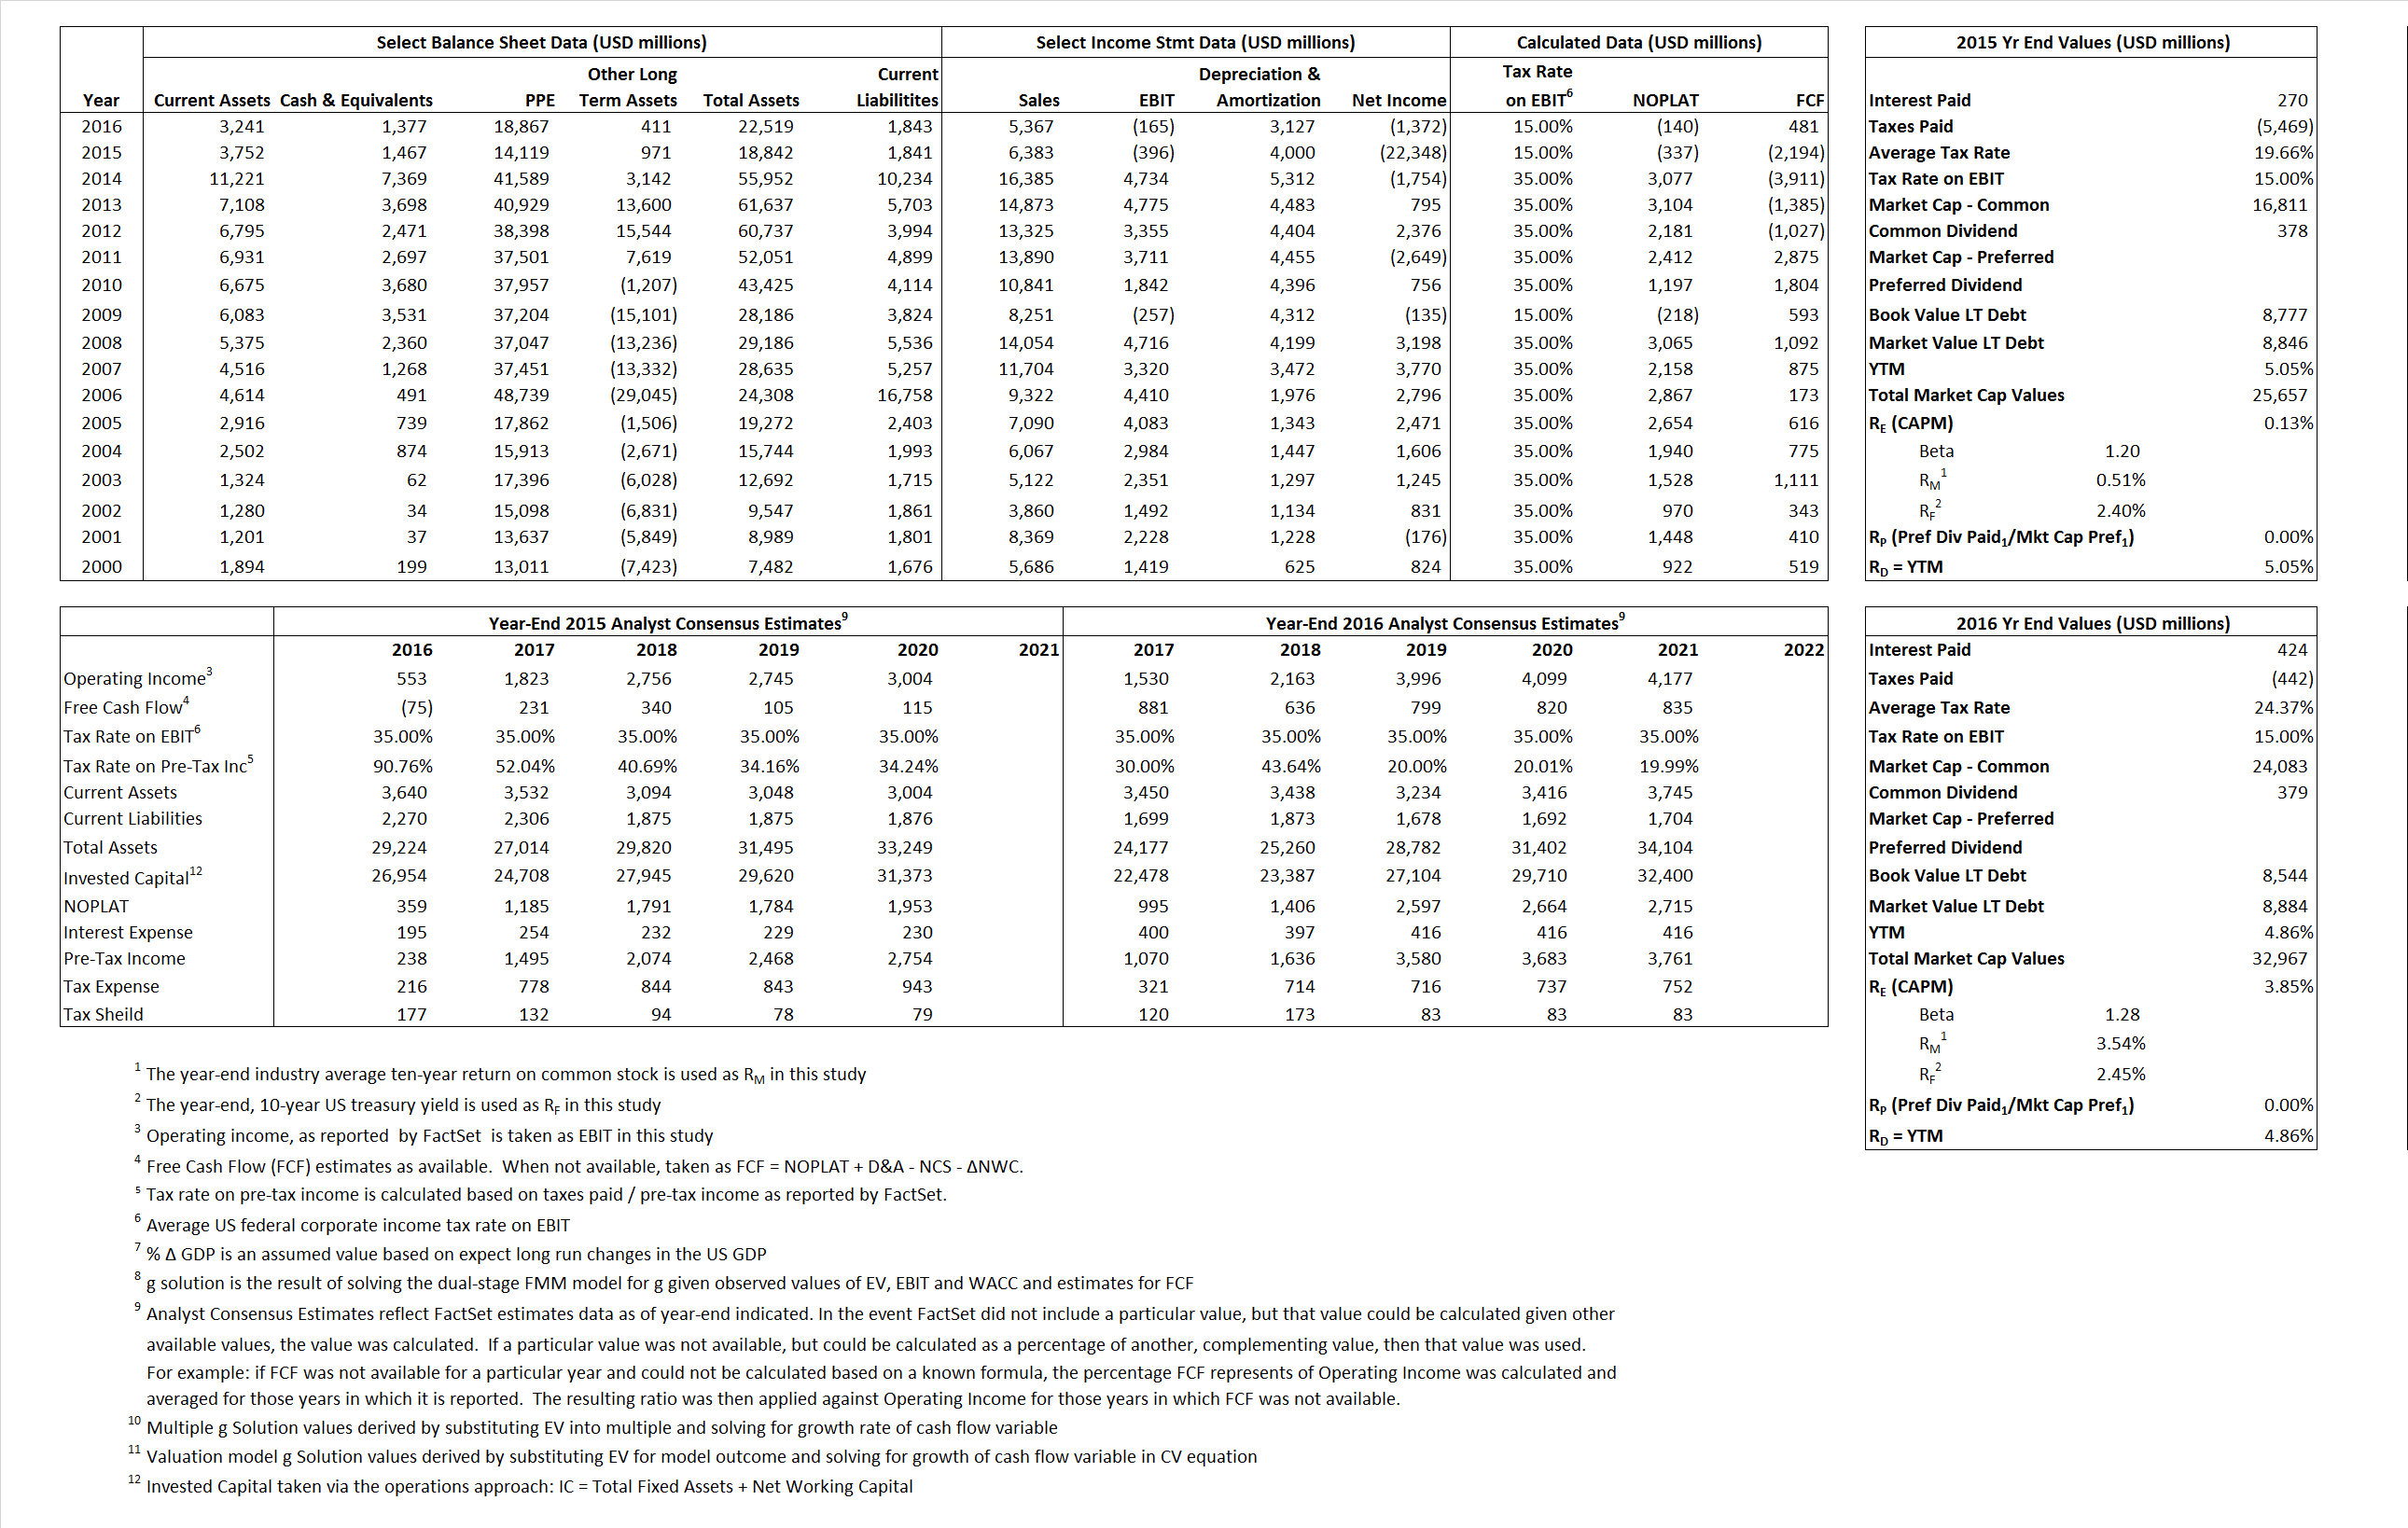
Primary Input Data
Derived Input Data
Derived Input |
Label |
2015 Value |
2016
|
Equational Form |
| Net Operating Profit Less Adjusted Taxes | NOPLAT | (337) | (140) |  |
| Free Cash Flow | FCF | (2,194) | 481 |  |
| Tax Shield | TS | 53 | 103 |  |
| Invested Capital | IC | 17,001 | 20,676 |  |
| Return on Invested Capital | ROIC | -1.98% | -0.68% |  |
| Net Investment | NetInv | (24,717) | 6,802 |  |
| Investment Rate | IR | 7,343.14% | -4,849.91% |  |
| Weighted Average Cost of Capital |
WACCMarket | 1.49% | 3.80% |  |
| WACCBook | 8.20% | 8.88% | ||
| Enterprise value |
EVMarket | 24,190 | 31,590 |  |
| EVBook | 24,121 | 31,250 | ||
| Long-Run Growth |
g = IR x ROIC |
-145.39% | 32.90% | Long-run growth rates of the income variable are used in the Continuing Value portion of the valuation models. |
g = %  GDP GDP |
2.50% | 2.50% | ||
| Margin from Operations | M | -6.20% | -3.07% |  |
| Depreciation/Amortization Rate | D | 110.99% | 105.57% |  |
Valuation Multiple Outcomes
The outcomes presented in this study are the result of original input data, derived data, and synthesized inputs.
Equational Form |
Observed Value |
Single-stagemultiple g solution |
Two-stage valuationmodel g solution |
|||
| 12/31/2015 | 12/31/2016 | 12/31/2015 | 12/31/2016 | 12/31/2015 | 12/31/2016 | |
|
|
3.79 | 5.89 | 9.68% | 12.28% | 8.58% | 9.12% |
|
|
6.71 | 10.66 | 9.68% | 12.28% | 8.58% | 9.12% |
|
|
-71.87 | -225.24 | 9.68% | 12.28% | 8.58% | 9.12% |
|
|
-11.03 | 65.67 | 9.68% | 12.28% | 8.58% | 9.12% |
|
|
-61.09 | -191.45 | 9.68% | 12.28% | 8.58% | 9.12% |
|
|
1.42 | 1.53 | 9.68% | 12.28% | 8.58% | 9.12% |


