Kinder Morgan Inc/DE
Analyst Listing
The following analysts provide coverage for the subject firm as of May 2016:
Primary Input Data
Derived Input Data
Derived Input |
Label |
2015 Value |
2016
|
Equational Form |
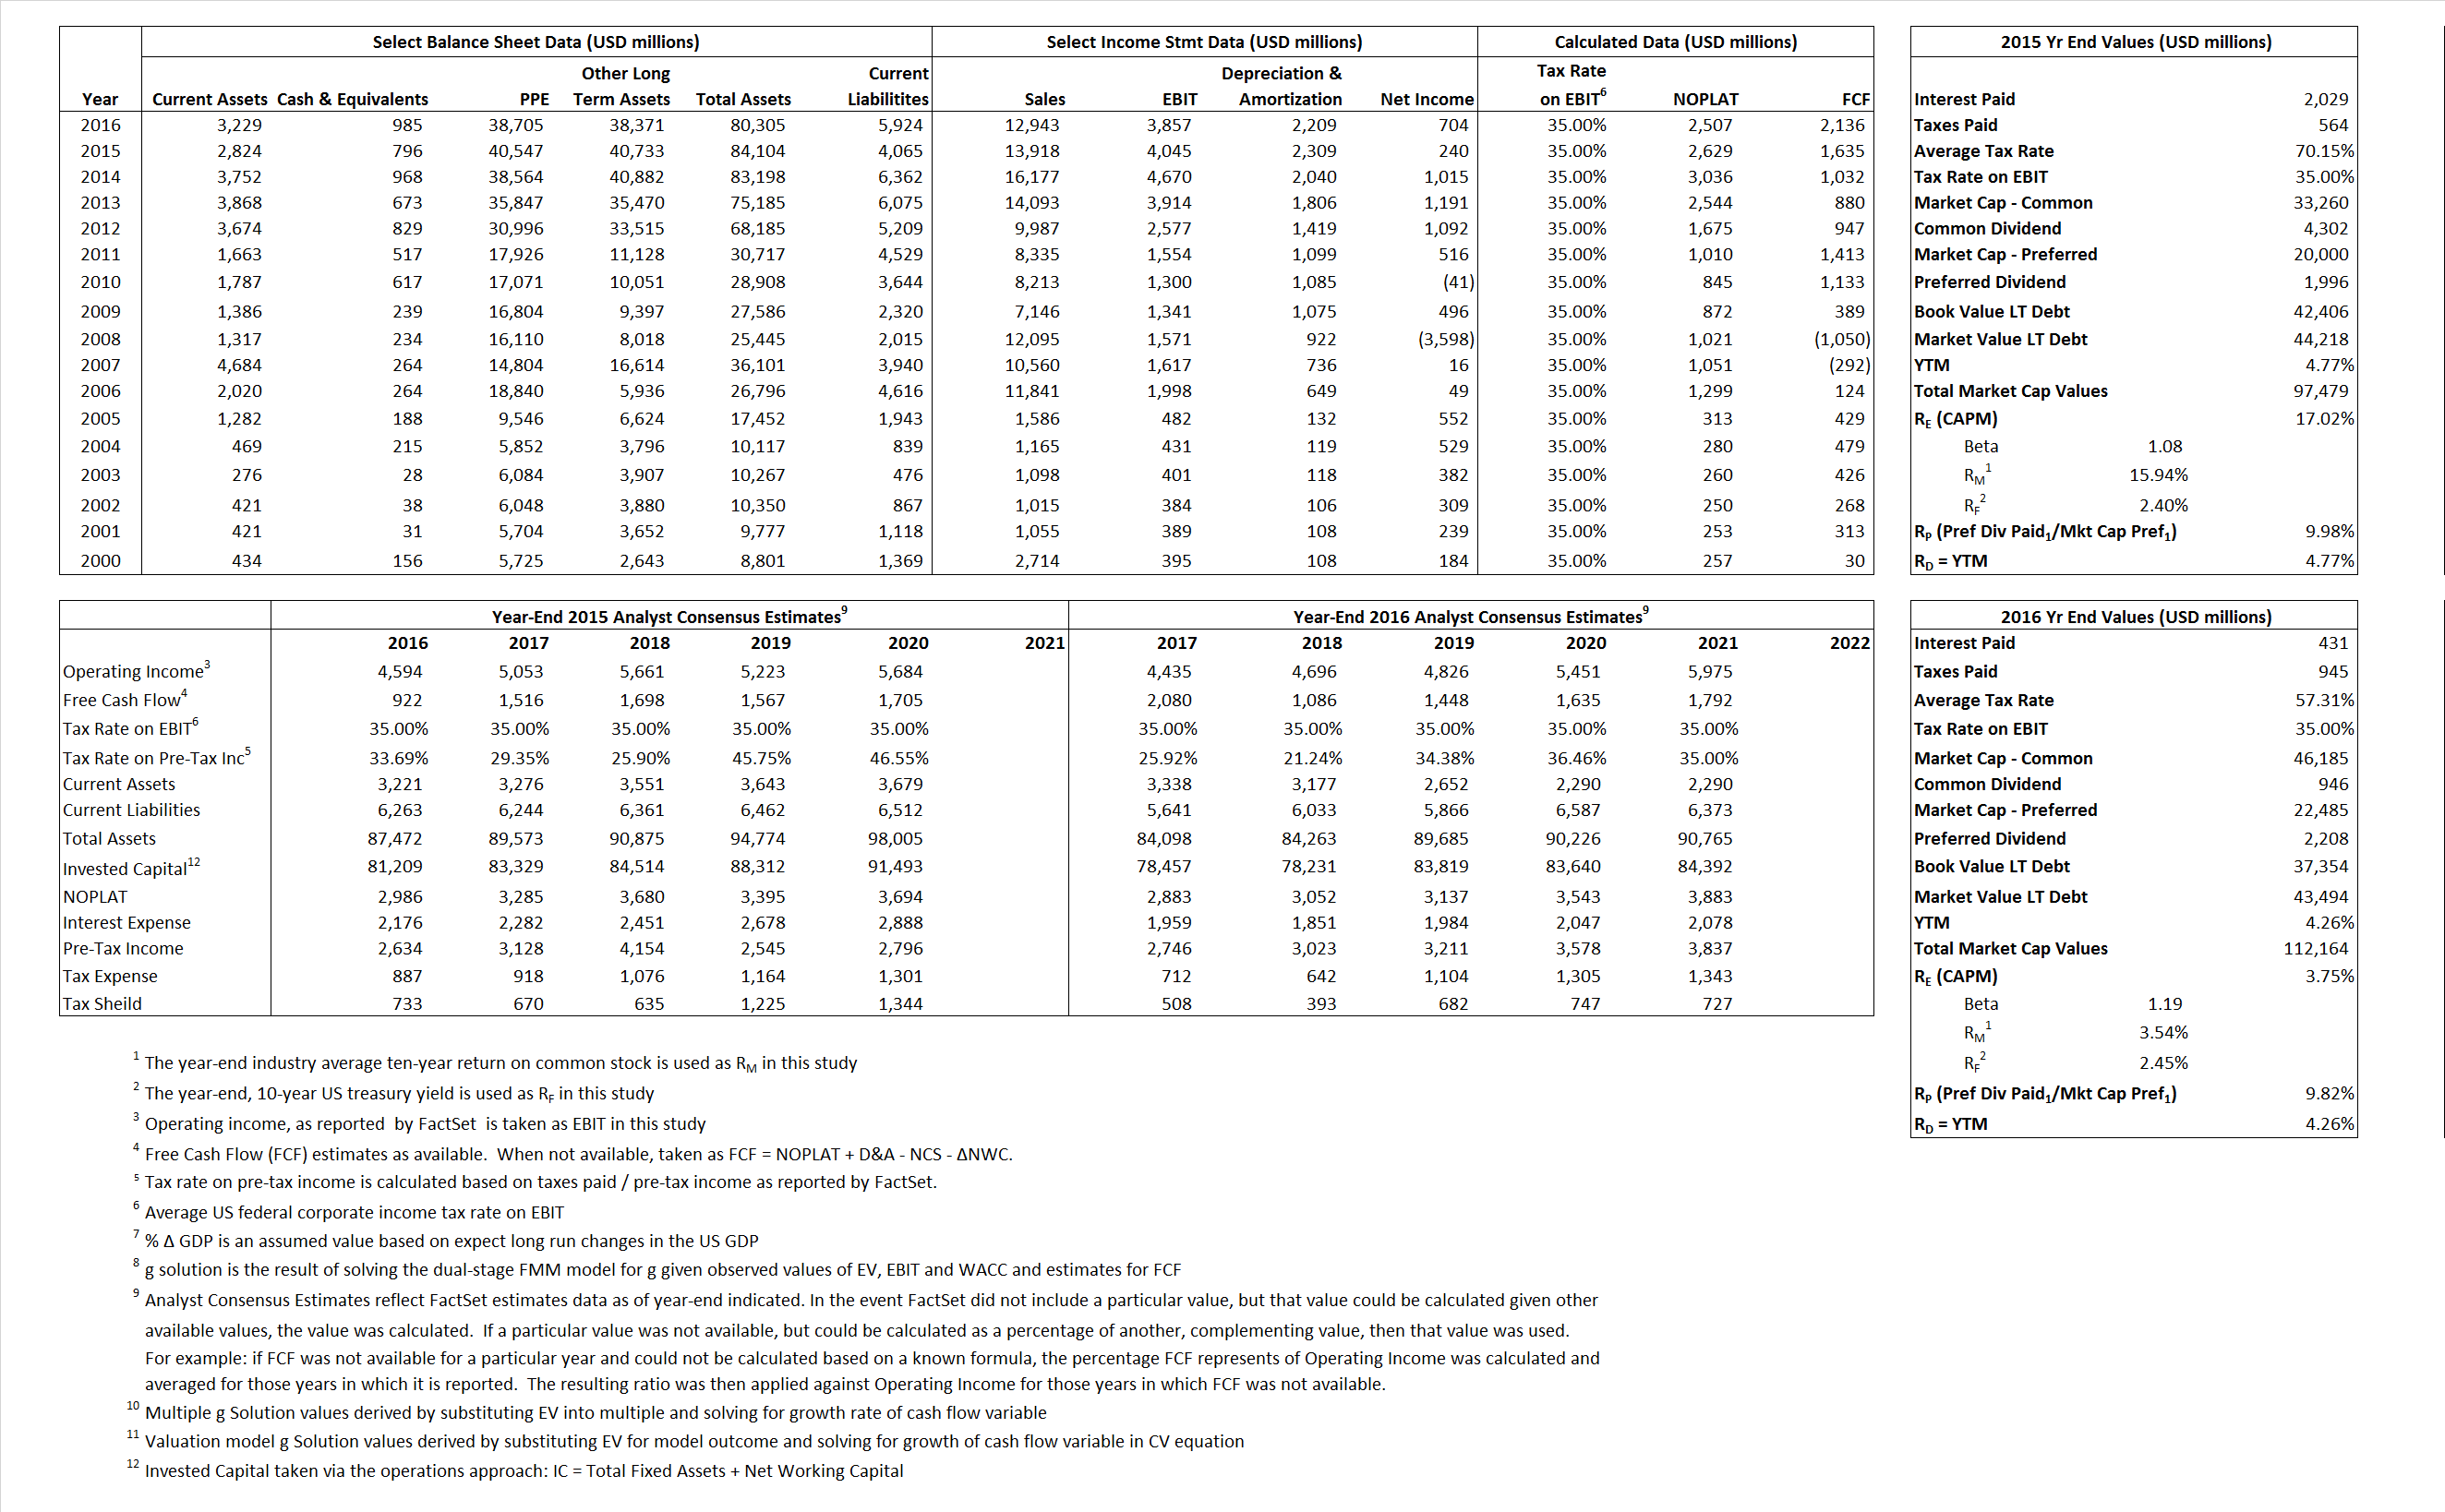
| Net Operating Profit Less Adjusted Taxes | NOPLAT | 2,629 | 2,507 |  |
| Free Cash Flow | FCF | 1,635 | 2,136 |  |
| Tax Shield | TS | 1,423 | 247 |  |
| Invested Capital | IC | 80,039 | 74,381 |  |
| Return on Invested Capital | ROIC | 3.28% | 3.37% |  |
| Net Investment | NetInv | 5,512 | (3,449) |  |
| Investment Rate | IR | 209.64% | -137.57% |  |
| Weighted Average Cost of Capital |
WACCMarket | 8.50% | 4.22% |  |
| WACCBook | 5.19% | 6.23% | ||
| Enterprise value |
EVMarket | 96,683 | 111,179 |  |
| EVBook | 94,681 | 105,039 | ||
| Long-Run Growth |
g = IR x ROIC |
6.89% | -4.64% | Long-run growth rates of the income variable are used in the Continuing Value portion of the valuation models. |
g = %  GDP GDP |
2.50% | 2.50% | ||
| Margin from Operations | M | 29.06% | 29.80% |  |
| Depreciation/Amortization Rate | D | 36.34% | 36.42% |  |
Valuation Multiple Outcomes
The outcomes presented in this study are the result of original input data, derived data, and synthesized inputs.
Equational Form |
Observed Value |
Single-stagemultiple g solution |
Two-stage valuationmodel g solution |
|||
| 12/31/2015 | 12/31/2016 | 12/31/2015 | 12/31/2016 | 12/31/2015 | 12/31/2016 | |
|
|
6.95 | 8.59 | 33.59% | 5.93% | 15.86% | 5.23% |
|
|
15.22 | 18.33 | 33.59% | 5.93% | 15.86% | 5.23% |
|
|
36.77 | 4.35 | 33.59% | 5.93% | 15.86% | 5.23% |
|
|
59.13 | 52.05 | 33.59% | 5.93% | 15.86% | 5.23% |
|
|
23.90 | 28.83 | 33.59% | 5.93% | 15.86% | 5.23% |
|
|
1.21 | 1.49 | 33.59% | 5.93% | 15.86% | 5.23% |


