Pepsi Co
Analyst Listing
The following analysts provide coverage for the subject firm as of May 2016:
| Broker | Analyst | Analyst Email |
| Bernstein Research | Ali Dibadj | ali.dibadj@bernstein.com |
| BMO Capital Markets | Amit Sharma | amit.sharma@bmo.com |
| CRT Capital Group | April Scee | ascee@sterneageerct.com |
| Deutsche Bank Research | Bill Schmitz Jr. | william.schmitz@db.com |
| Wells Fargo Securities | Bonnie Herzog | bonnie.herzog@wellsfargo.com |
| Consumer Edge Research | Brett Cooper | bcooper@consumeredgeresearch.com |
| Athlos Research | Jonathan P. Feeney | jonathan@athlosresearch.com |
| First Global Stockbroking | Kavita Thomas | kavita.thomas@fglobal.com |
| Jefferies | Kevin Grundy | kgrundy@jefferies.com |
| Stifel Nicolaus | Mark D. Swartzberg | mswartzberg@stifel.com |
| RBC Capital Markets | Nik Modi | nik.modi@rbccm.com |
| Susquehanna Financial Group | Pablo Zuanic | pablo.zuanic@sig.com |
| Evercore ISI | Robert Ottenstein | robert.ottenstein@evercoreisi.com |
| Cowen & Company | Vivien Azer | vivien.azer@cowen.com |
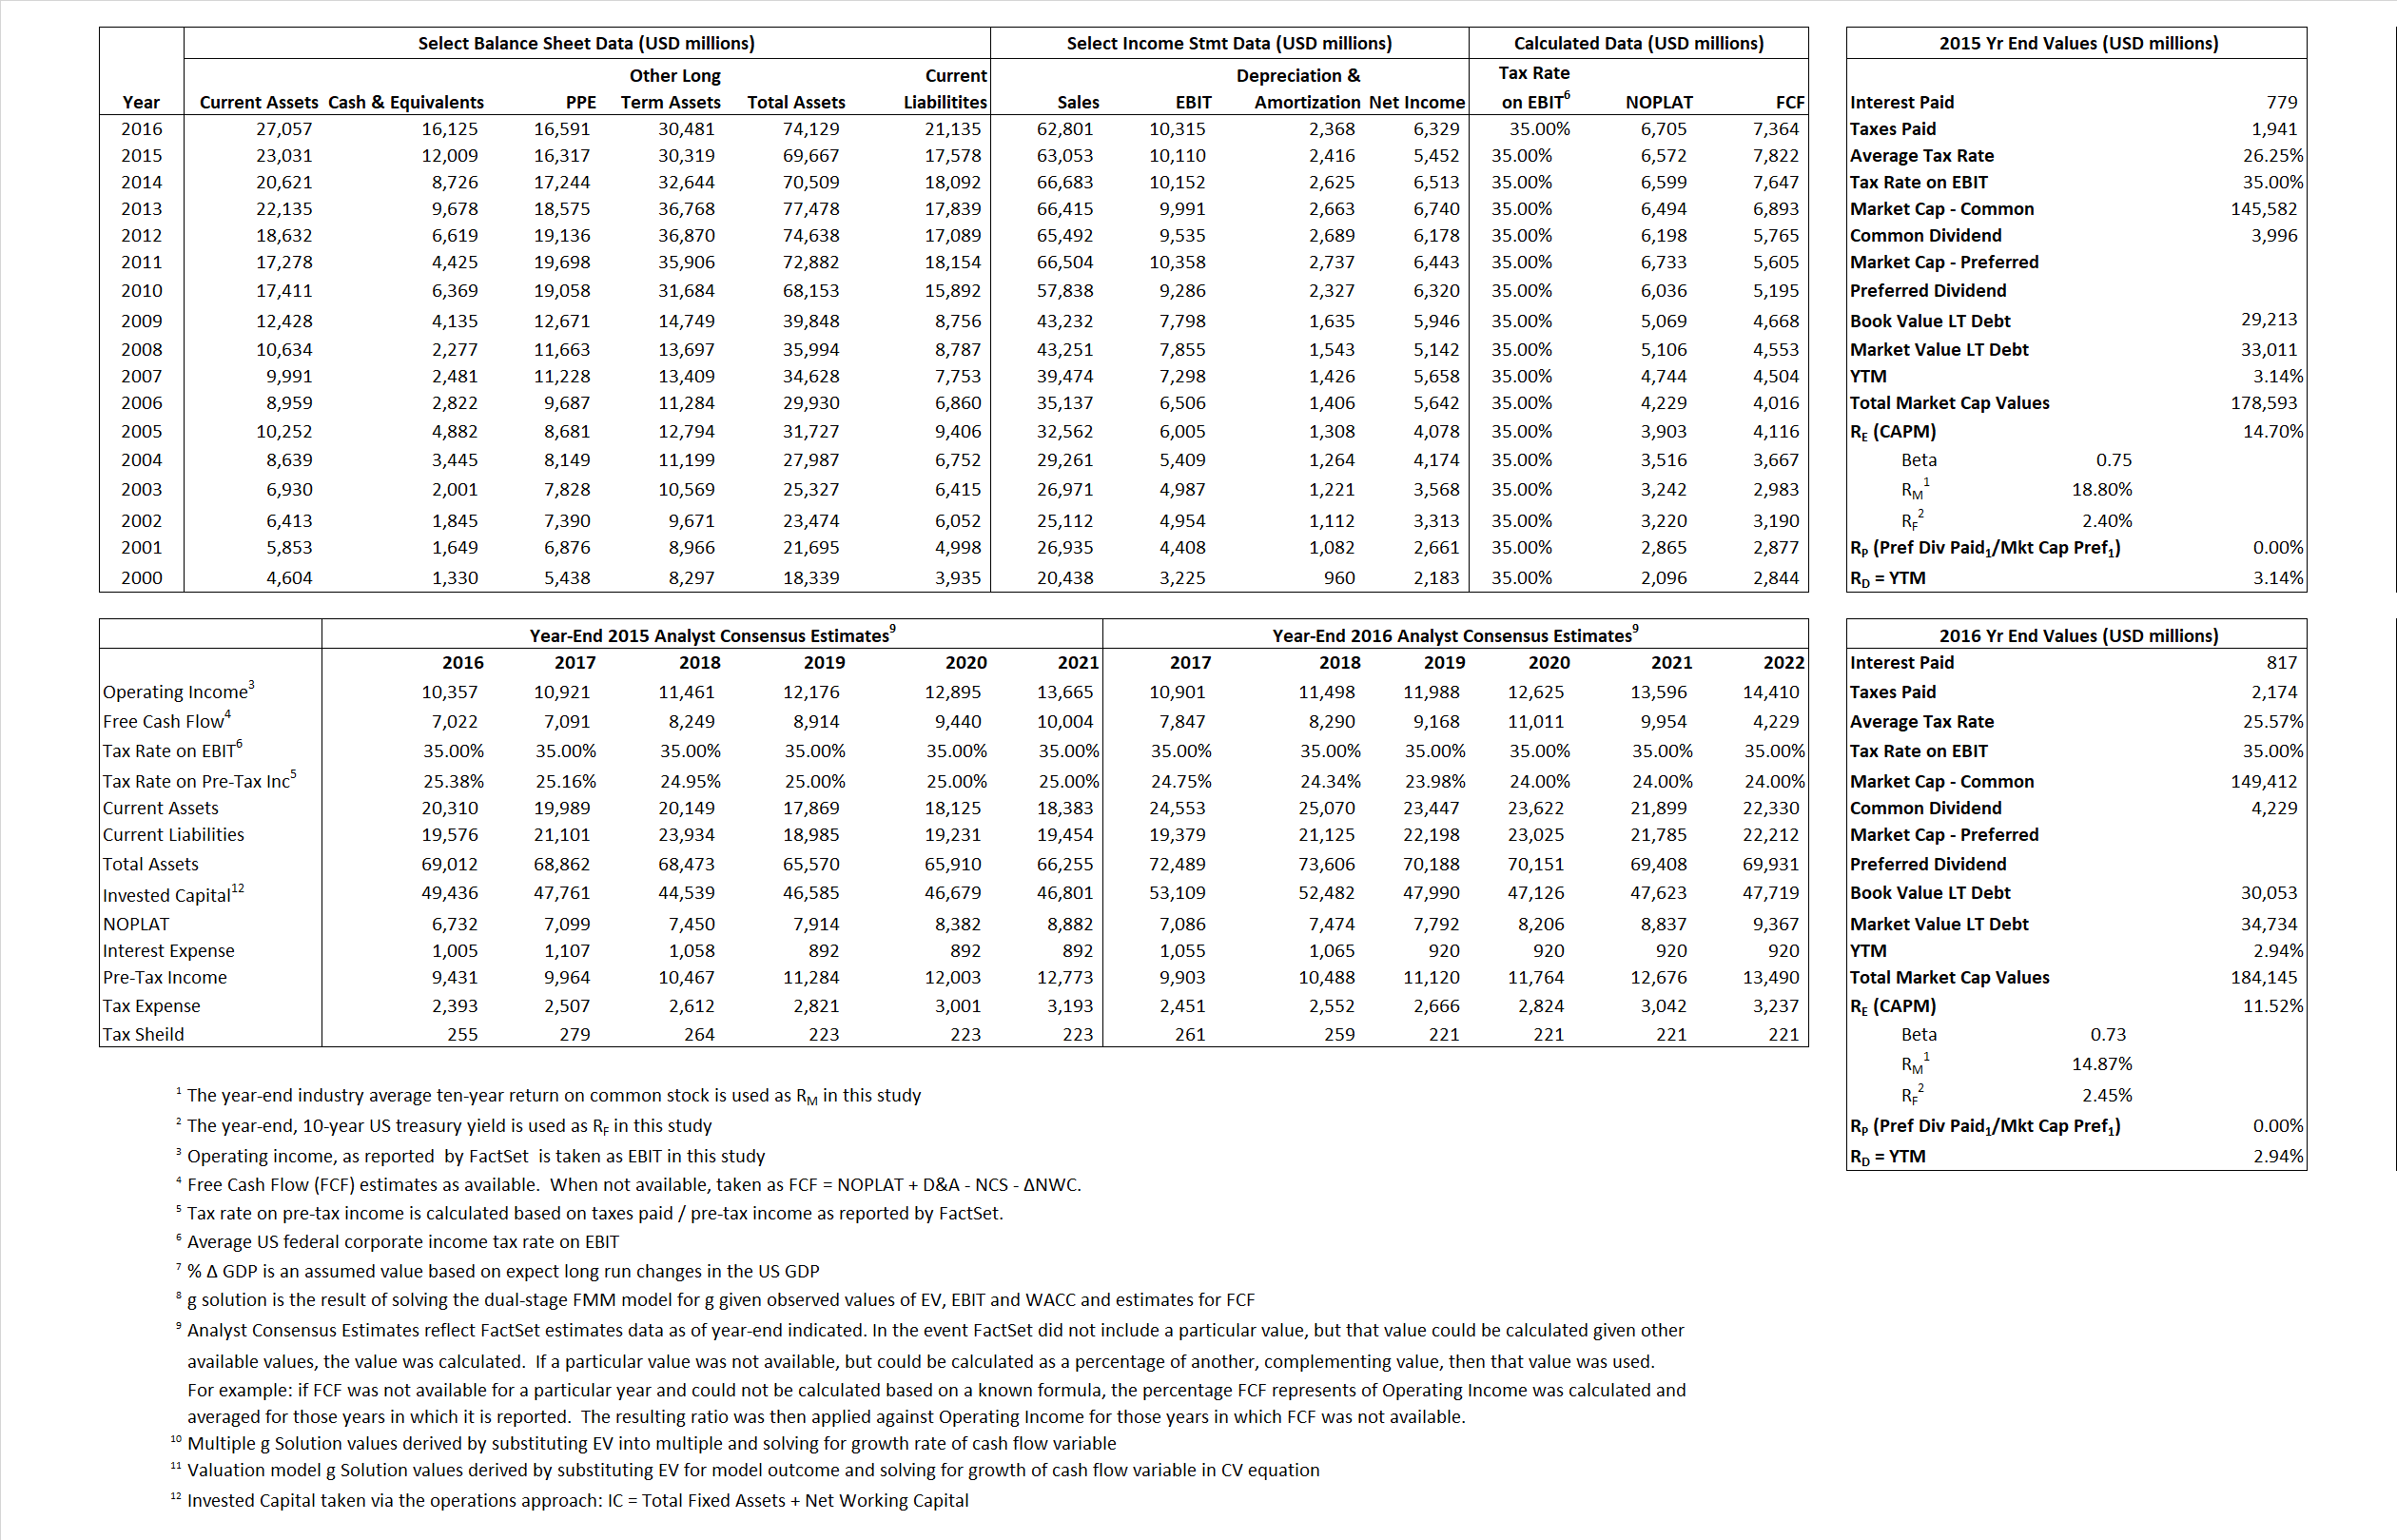
Primary Input Data
Derived Input Data
Derived Input |
Label |
2015 Value |
2016
|
Equational Form |
| Net Operating Profit Less Adjusted Taxes | NOPLAT | 6,572 | 6,705 |  |
| Free Cash Flow | FCF | 7,822 | 7,364 |  |
| Tax Shield | TS | 205 | 209 |  |
| Invested Capital | IC | 52,089 | 52,994 |  |
| Return on Invested Capital | ROIC | 12.62% | 12.65% |  |
| Net Investment | NetInv | 2,088 | 3,273 |  |
| Investment Rate | IR | 31.77% | 48.82% |  |
| Weighted Average Cost of Capital |
WACCMarket | 12.41% | 9.76% |  |
| WACCBook | 6.55% | 6.23% | ||
| Enterprise value |
EVMarket | 166,584 | 168,020 |  |
| EVBook | 158,670 | 163,340 | ||
| Long-Run Growth |
g = IR x ROIC |
4.01% | 6.18% | Long-run growth rates of the income variable are used in the Continuing Value portion of the valuation models. |
g = %  GDP GDP |
2.50% | 2.50% | ||
| Margin from Operations | M | 16.03% | 16.42% |  |
| Depreciation/Amortization Rate | D | 19.29% | 18.67% |  |
Valuation Multiple Outcomes
The outcomes presented in this study are the result of original input data, derived data, and synthesized inputs.
Equational Form |
Observed Value |
Single-stagemultiple g solution |
Two-stage valuationmodel g solution |
|||
| 12/31/2015 | 12/31/2016 | 12/31/2015 | 12/31/2016 | 12/31/2015 | 12/31/2016 | |
|
|
2.64 | 2.68 | 12.32% | 8.42% | 12.36% | 9.04% |
|
|
13.30 | 13.25 | 12.32% | 8.42% | 12.36% | 9.04% |
|
|
25.35 | 25.06 | 12.32% | 8.42% | 12.36% | 9.04% |
|
|
21.30 | 22.82 | 12.32% | 8.42% | 12.36% | 9.04% |
|
|
16.48 | 16.29 | 12.32% | 8.42% | 12.36% | 9.04% |
|
|
3.20 | 3.17 | 12.32% | 8.42% | 12.36% | 9.04% |


