Starbucks Corporation
Analyst Listing
The following analysts provide coverage for the subject firm as of May 2016:
| Broker | Analyst | Analyst Email |
| Cowen & Company | Andrew M. Charles | andrew.charles@cowen.com |
| BMO Capital Markets | Andrew Strelzik | andrew.strelzik@bmo.com |
| Deutsche Bank Research | Brett Levy | brett.levy@db.com |
| Oppenheimer | Brian Bittner | brian.bittner@opco.com |
| RBC Capital Markets | David Palmer | david.palmer@rbccm.com |
| Credit Suisse | Jason West | jason.west@credit-suisse.com |
| Nomura Research | Mark Kalinowski | mark.kalinowski@nomura.com |
| Stifel Nicolaus | Mark S. Astrachan | msastrachan@stifel.com |
| Evercore ISI | Matt McGinley | matt.mcginley@evercoreisi.com |
| Guggenheim Securities | Matthew J. Difrisco | matthew.difrisco@guggenheimpartners.com |
| Wedbush Securities | Nick Setyan | nick.setyan@wedbush.com |
| BTIG | Peter Saleh | psaleh@btig.com |
| William Blair | Sharon Zackfia | szackfia@williamblair.com |
| Stephens Inc | Will Slabaugh | will.slabaugh@stephens.com |
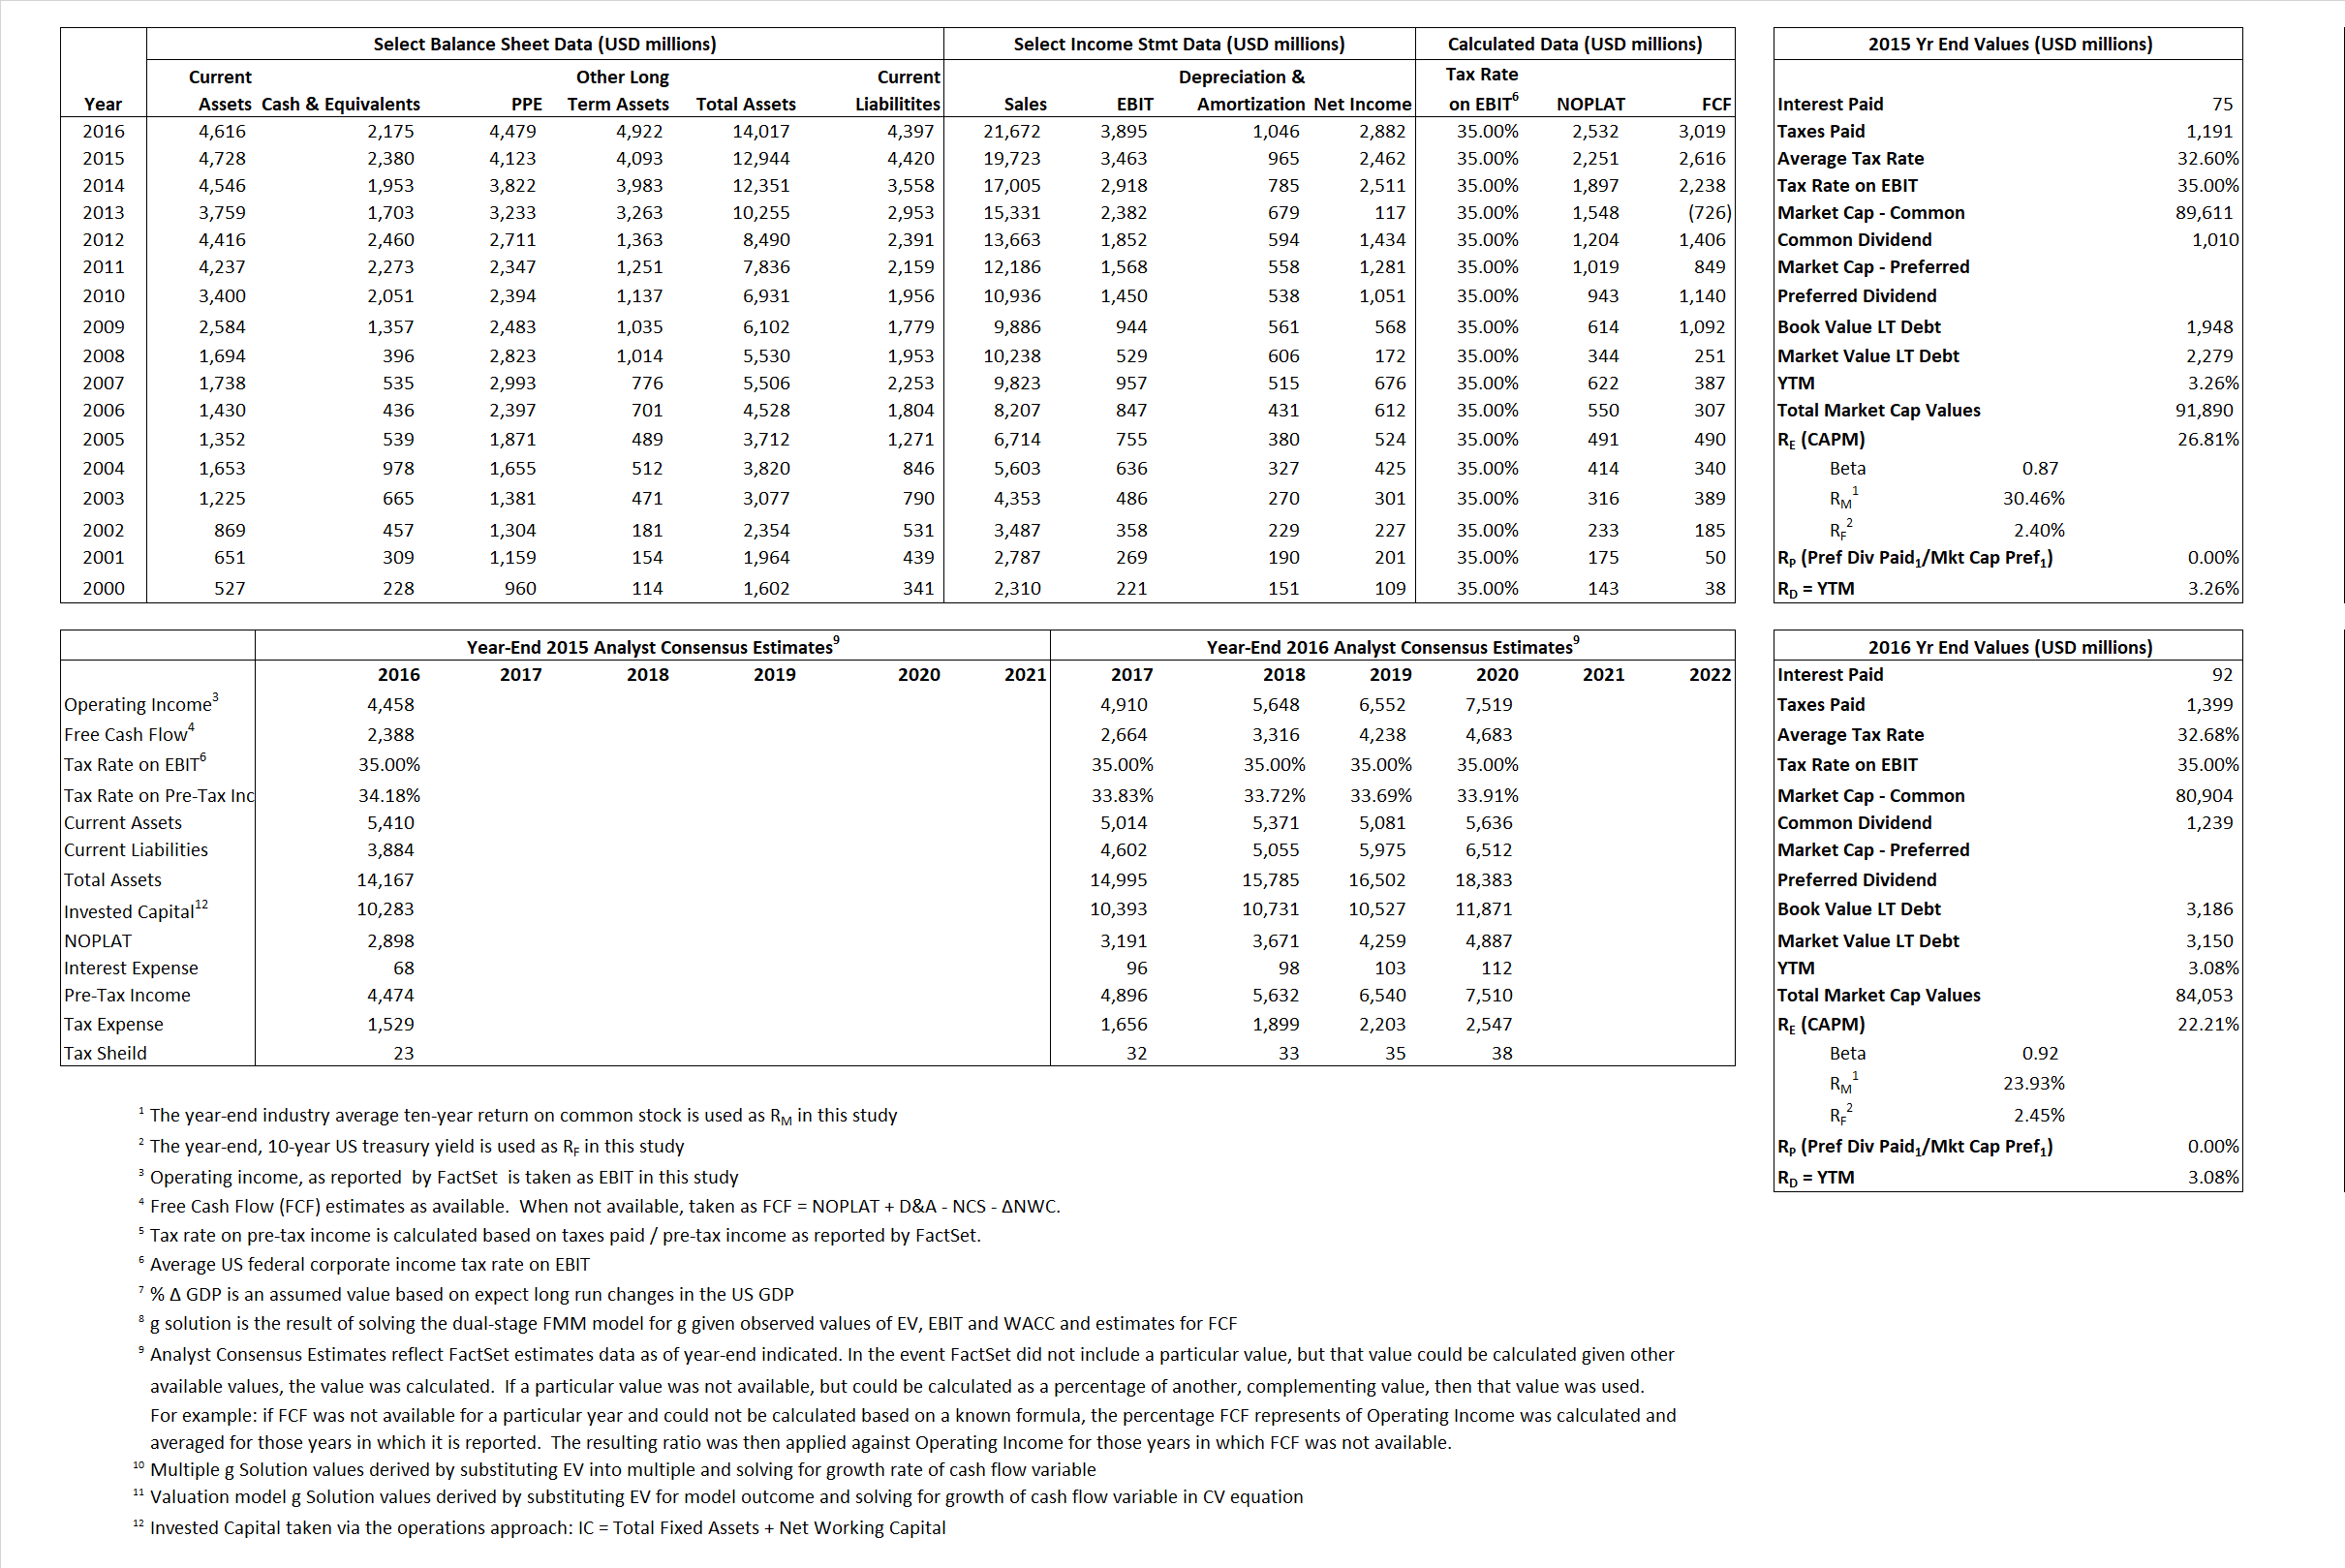
Primary Input Data
Derived Input Data
Derived Input |
Label |
2015 Value |
2016
|
Equational Form |
| Net Operating Profit Less Adjusted Taxes | NOPLAT | 2,251 | 2,532 |  |
| Free Cash Flow | FCF | 2,616 | 3,019 |  |
| Tax Shield | TS | 24 | 30 |  |
| Invested Capital | IC | 8,523 | 9,620 |  |
| Return on Invested Capital | ROIC | 26.41% | 26.32% |  |
| Net Investment | NetInv | 695 | 2,142 |  |
| Investment Rate | IR | 30.86% | 84.62% |  |
| Weighted Average Cost of Capital |
WACCMarket | 26.20% | 21.46% |  |
| WACCBook | 8.45% | 8.29% | ||
| Enterprise value |
EVMarket | 89,510 | 81,878 |  |
| EVBook | 89,384 | 81,914 | ||
| Long-Run Growth |
g = IR x ROIC |
8.15% | 22.27% | Long-run growth rates of the income variable are used in the Continuing Value portion of the valuation models. |
g = %  GDP GDP |
2.50% | 2.50% | ||
| Margin from Operations | M | 17.56% | 17.97% |  |
| Depreciation/Amortization Rate | D | 21.79% | 21.17% |  |
Valuation Multiple Outcomes
The outcomes presented in this study are the result of original input data, derived data, and synthesized inputs.
Equational Form |
Observed Value |
Single-stagemultiple g solution |
Two-stage valuationmodel g solution |
|||
| 12/31/2015 | 12/31/2016 | 12/31/2015 | 12/31/2016 | 12/31/2015 | 12/31/2016 | |
|
|
4.54 | 3.78 | 26.18% | 20.81% | 26.18% | 21.18% |
|
|
20.22 | 16.57 | 26.18% | 20.81% | 26.18% | 21.18% |
|
|
39.77 | 32.34 | 26.18% | 20.81% | 26.18% | 21.18% |
|
|
34.21 | 27.12 | 26.18% | 20.81% | 26.18% | 21.18% |
|
|
25.85 | 21.02 | 26.18% | 20.81% | 26.18% | 21.18% |
|
|
10.50 | 8.51 | 26.18% | 20.81% | 26.18% | 21.18% |


