Analyst Listing
The following analysts provide coverage for the subject firm as of May 2016:
| Broker | Analyst | Analyst Email |
| Raymond James | Aaron Kessler | aaron.kessler@raymondjames.com |
| Nomura Research | Anthony DiClemente | anthony.diclemente@nomura.com |
| CRT Capital Group | Arvind Bhatia | abhatia@sterneageecrt.com |
| Sterne Agee & Leach | Arvind Bhatia | abhatia@sterneageecrt.com |
| Pivotal Research Group | Brian Wieser | brian@pvtl.com |
| Bernstein Research | Carlos Kirjner | carlos.kirjner@bernstein.com |
| Atlantic Equities | James Cordwell | j.cordwell@atlantic-equities.com |
| Oppenheimer | Jason Helfstein | jason.helfstein@opco.com |
| Cowen & Company | John Blackledge | john.blackledge@cowen.com |
| Needham | Laura Martin | lmartin@needhamco.com |
| Rosenblatt Securities | Martin Pyykkonen | mpyykkonen@rblt.com |
| Wedbush Securities | Michael Pachter | michael.pachter@wedbush.com |
| Wells Fargo Securities | Peter Stabler | peter.stabler@wellsfargo.com |
| William Blair | Ralph Schackart | rschackart@williamblair.com |
| SunTrust Robinson Humphrey | Robert S. Peck | robert.peck@suntrust.com |
| JMP Securities | Ronald V. Josey | rjosey@jmpsecurities.com |
| Deutsche Bank Research | Ross Sandler | ross.sandler@db.com |
| Stifel Nicolaus | Scott W. Devitt | swdevitt@stifel.com |
| Susquehanna Financial Group | Shyam Patil | shyam.patil@sig.com |
| Credit Suisse | Stephen Ju | stephen.ju@credit-suisse.com |
| Hilliard Lyons | Stephen Turner | sturner@hilliard.com |
| Cantor Fitzgerald | Youssef H. Squali | ysquali@cantor.com |
Primary Input Data
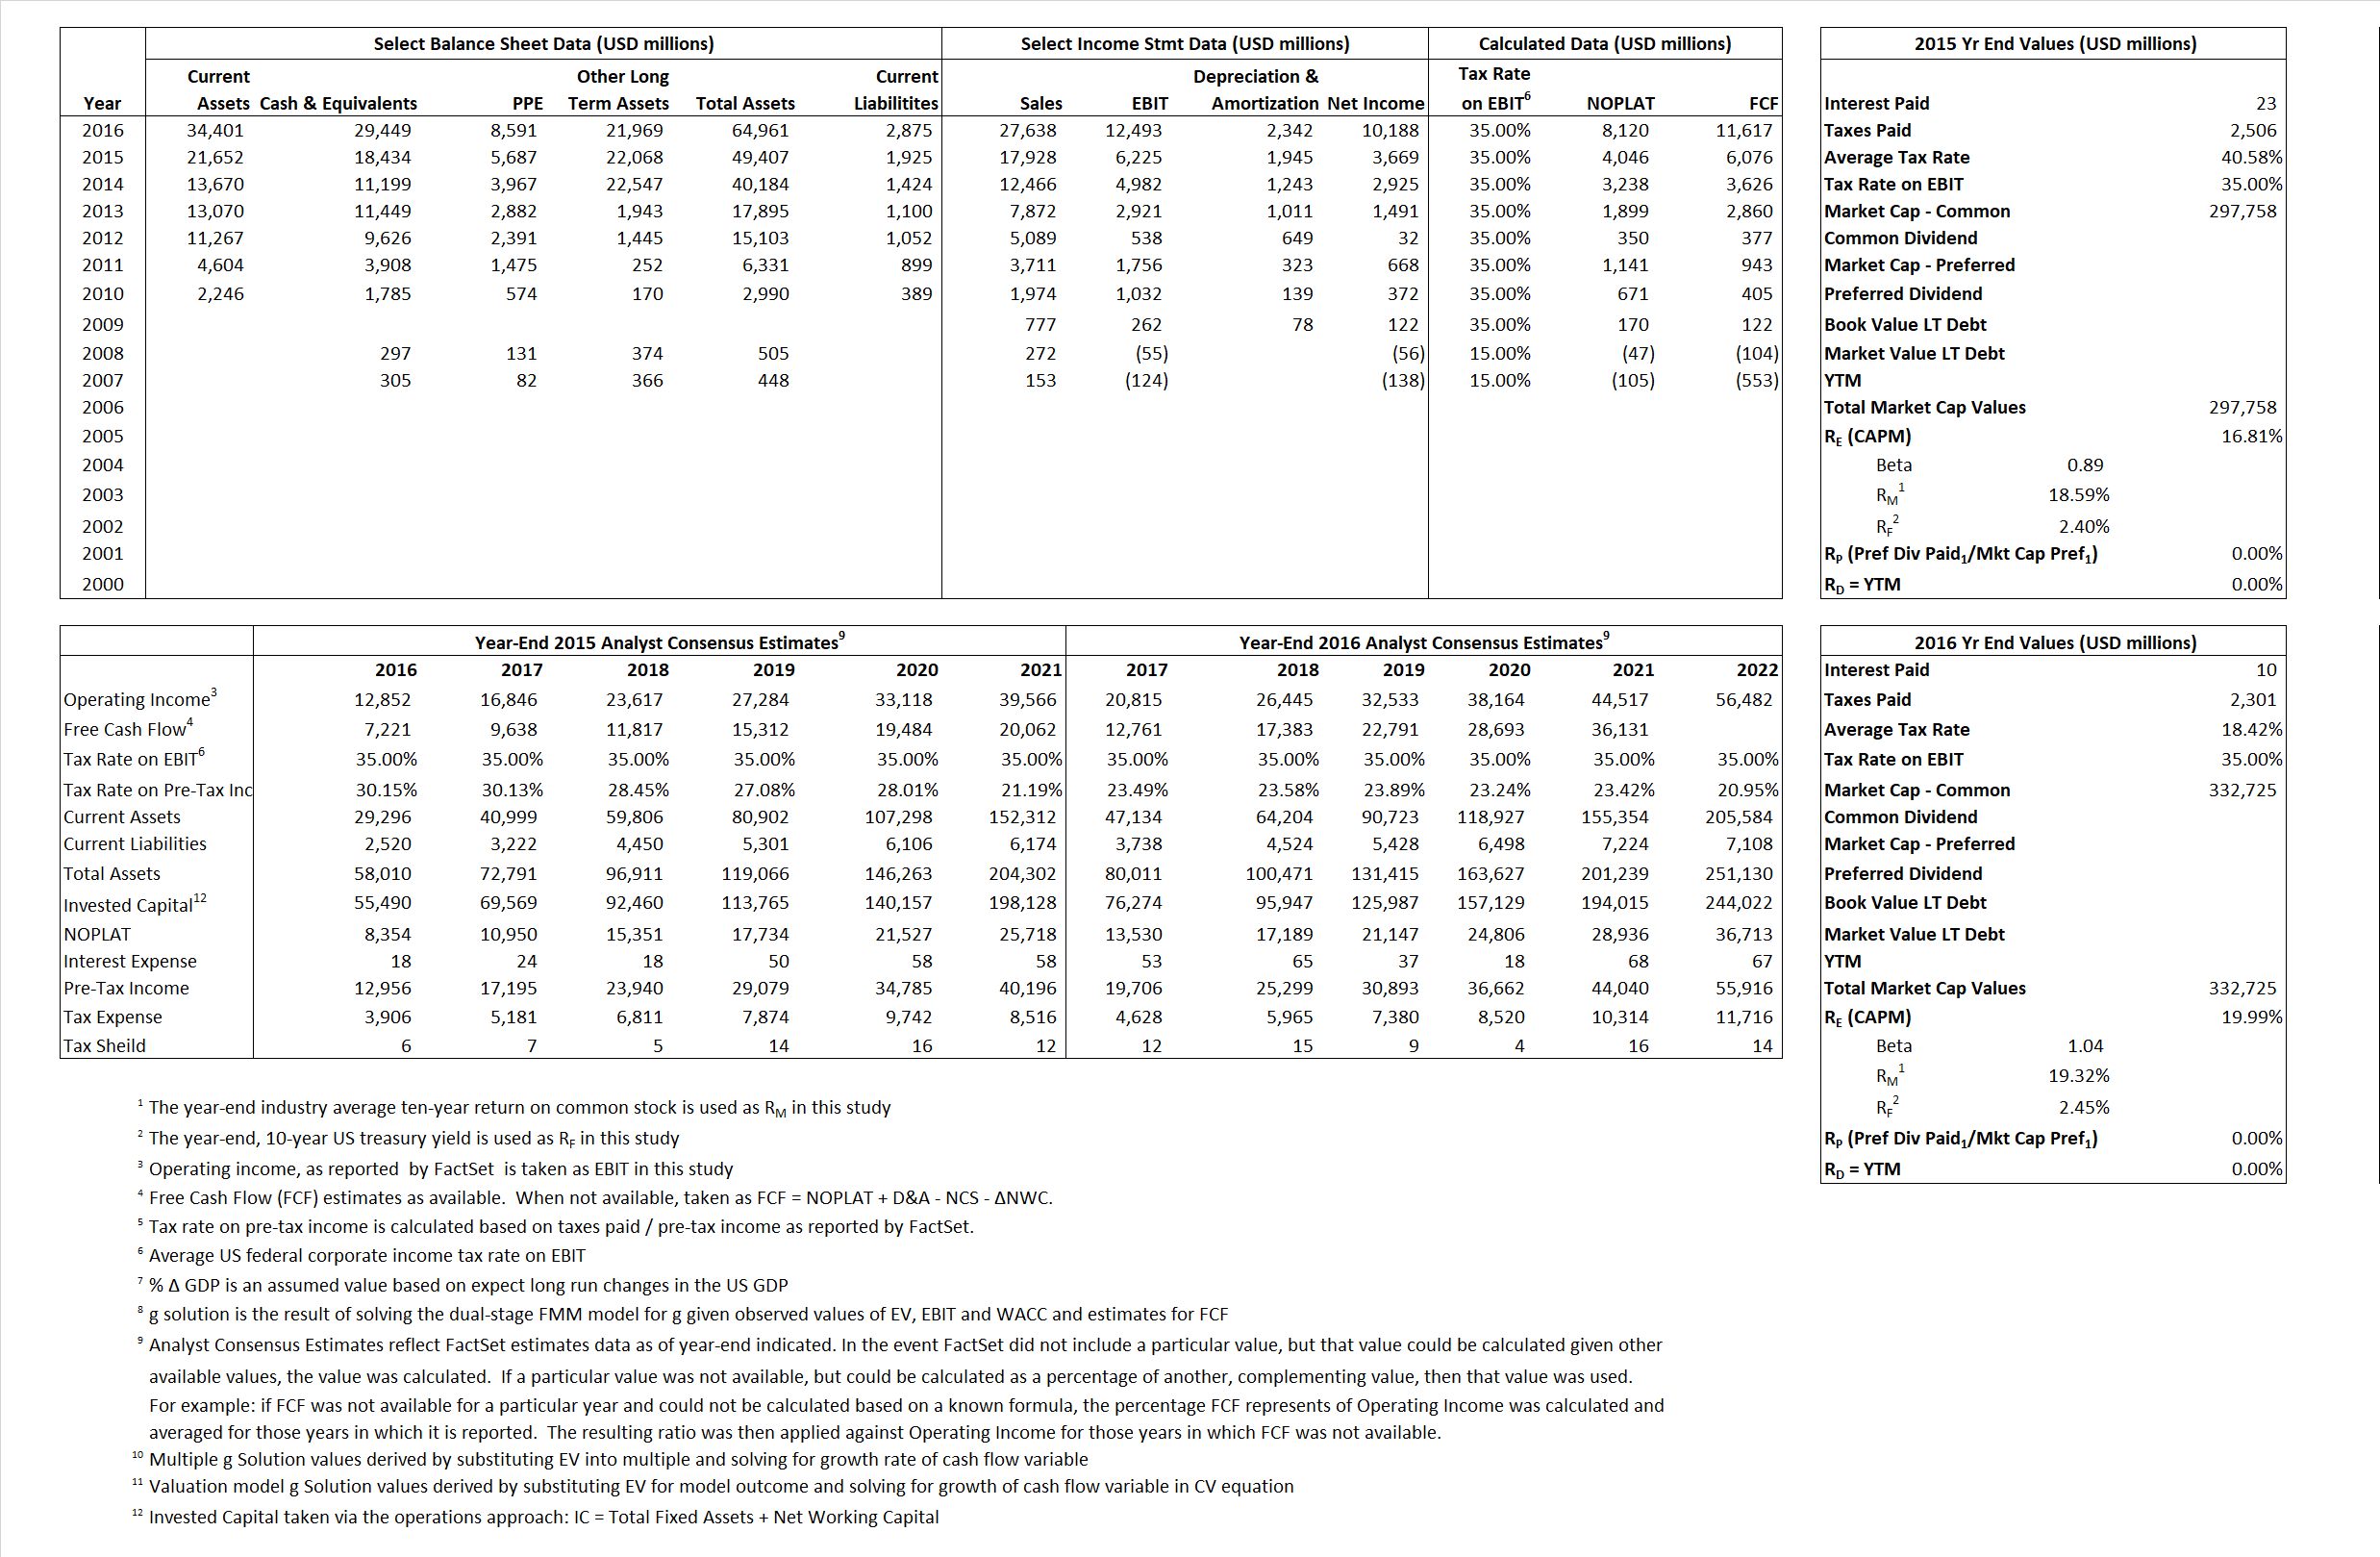
Derived Input Data
Derived Input |
Label |
2015 Value |
2016
|
Equational Form |
| Net Operating Profit Less Adjusted Taxes | NOPLAT | 4,046 | 8,120 |  |
| Free Cash Flow | FCF | 6,076 | 11,617 |  |
| Tax Shield | TS | 9 | 2 |  |
| Invested Capital | IC | 47,482 | 62,086 |  |
| Return on Invested Capital | ROIC | 8.52% | 13.08% |  |
| Net Investment | NetInv | 10,667 | 16,946 |  |
| Investment Rate | IR | 263.63% | 208.68% |  |
| Weighted Average Cost of Capital |
WACCMarket | 16.81% | 19.99% |  |
| WACCBook | 8.58% | 9.24% | ||
| Enterprise value |
EVMarket | 279,324 | 303,276 |  |
| EVBook | 279,324 | 303,276 | ||
| Long-Run Growth |
g = IR x ROIC |
22.47% | 27.29% | Long-run growth rates of the income variable are used in the Continuing Value portion of the valuation models. |
g = %  GDP GDP |
2.50% | 2.50% | ||
| Margin from Operations | M | 34.72% | 45.20% |  |
| Depreciation/Amortization Rate | D | 23.81% | 15.79% |  |
Valuation Multiple Outcomes
The outcomes presented in this study are the result of original input data, derived data, and synthesized inputs.
Equational Form |
Observed Value |
Single-stagemultiple g solution |
Two-stage valuationmodel g solution |
|||
| 12/31/2015 | 12/31/2016 | 12/31/2015 | 12/31/2016 | 12/31/2015 | 12/31/2016 | |
|
|
15.58 | 10.97 | 18.51% | 21.77% | 17.63% | 20.61% |
|
|
34.19 | 20.44 | 18.51% | 21.77% | 17.63% | 20.61% |
|
|
69.03 | 37.35 | 18.51% | 21.77% | 17.63% | 20.61% |
|
|
45.97 | 26.11 | 18.51% | 21.77% | 17.63% | 20.61% |
|
|
44.87 | 24.28 | 18.51% | 21.77% | 17.63% | 20.61% |
|
|
5.88 | 4.88 | 18.51% | 21.77% | 17.63% | 20.61% |


