Apple Inc.
Analyst Listing
The following analysts provide coverage for the subject firm as of May 2016:
| Broker | Analyst | Analyst Email |
| Stifel Nicolaus | Aaron Rakers | rakersa@stifel.com |
| Mizuho Securities USA | Abhey Lamba | abhey.lamba@us.mizuho-sc.com |
| RBC Capital Markets | Amit Daryanani | amit.daryanani@rbccm.com |
| Brean Capital, LLC | Ananda Baruah | abaruah@breancapital.com |
| Oppenheimer | Andrew Uerkwitz | andrew.uerkwitz@opco.com |
| Pacific Crest Securities-KBCM | Andy Hargreaves | ahargreaves@pacific-crest.com |
| Pacific Crest | Andy Hargreaves | ahargreaves@pacific-crest.com |
| William Blair | Anil Doradla | adoradla@williamblair.com |
| Drexel Hamilton | Brian J. White | bwhite@drexelhamilton.com |
| BGC Financial, L.P. | Colin W. Gillis | cgillis@bgcpartners.com |
| Piper Jaffray | Gene Munster | gene.a.munster@pjc.com |
| Atlantic Equities | James Cordwell | j.cordwell@atlantic-equities.com |
| Nomura Research | Jeffrey Kvaal | jeffrey.kvaal@nomura.com |
| Rosenblatt Securities | Jun Zhang | jzhang@rblt.com |
| Credit Suisse | Kulbinder Garcha | kulbinder.garcha@credit-suisse.com |
| Needham | Laura Martin | lmartin@needhamco.com |
| Wells Fargo Securities | Maynard J. Um | maynard.um@wellsfargo.com |
| Maxim Group | Nehal Chokshi | maynard.um@wellsfargo.com |
| CRT Capital Group | Rob Cihra | rcihra@sterneageecrt.com |
| Cross Research | Shannon Cross | shannon@crossresearch.com |
| FBN Securities | Shebly Seyrafi | sseyrafi@fbnsecurities.com |
| Deutsche Bank Research | Sherri Scribner | sherri.scribner@db.com |
| Hilliard Lyons | Stephen Turner | sturner@hilliard.com |
| Canaccord Genuity | T. Michael Walkley | mwalkley@canaccordgenuity.com |
| Raymond James | Tavis C. McCourt | tavis.mccourt@raymondjames.com |
| BMO Capital Markets | Tim Long | tim.long@bmo.com |
| Cowen & Company | Timothy Arcuri | timothy.arcuri@cowen.com |
| Bernstein Research | Toni M. Sacconaghi Jr | sacconaghi@bernstein.com |
| BTIG | Walter Piecyk | wpiecyk@btig.com |
| Daiwa Securities Co. Ltd. | Yoko Yamada | yoko.yamada@us.daiwacm.com |
Primary Input Data
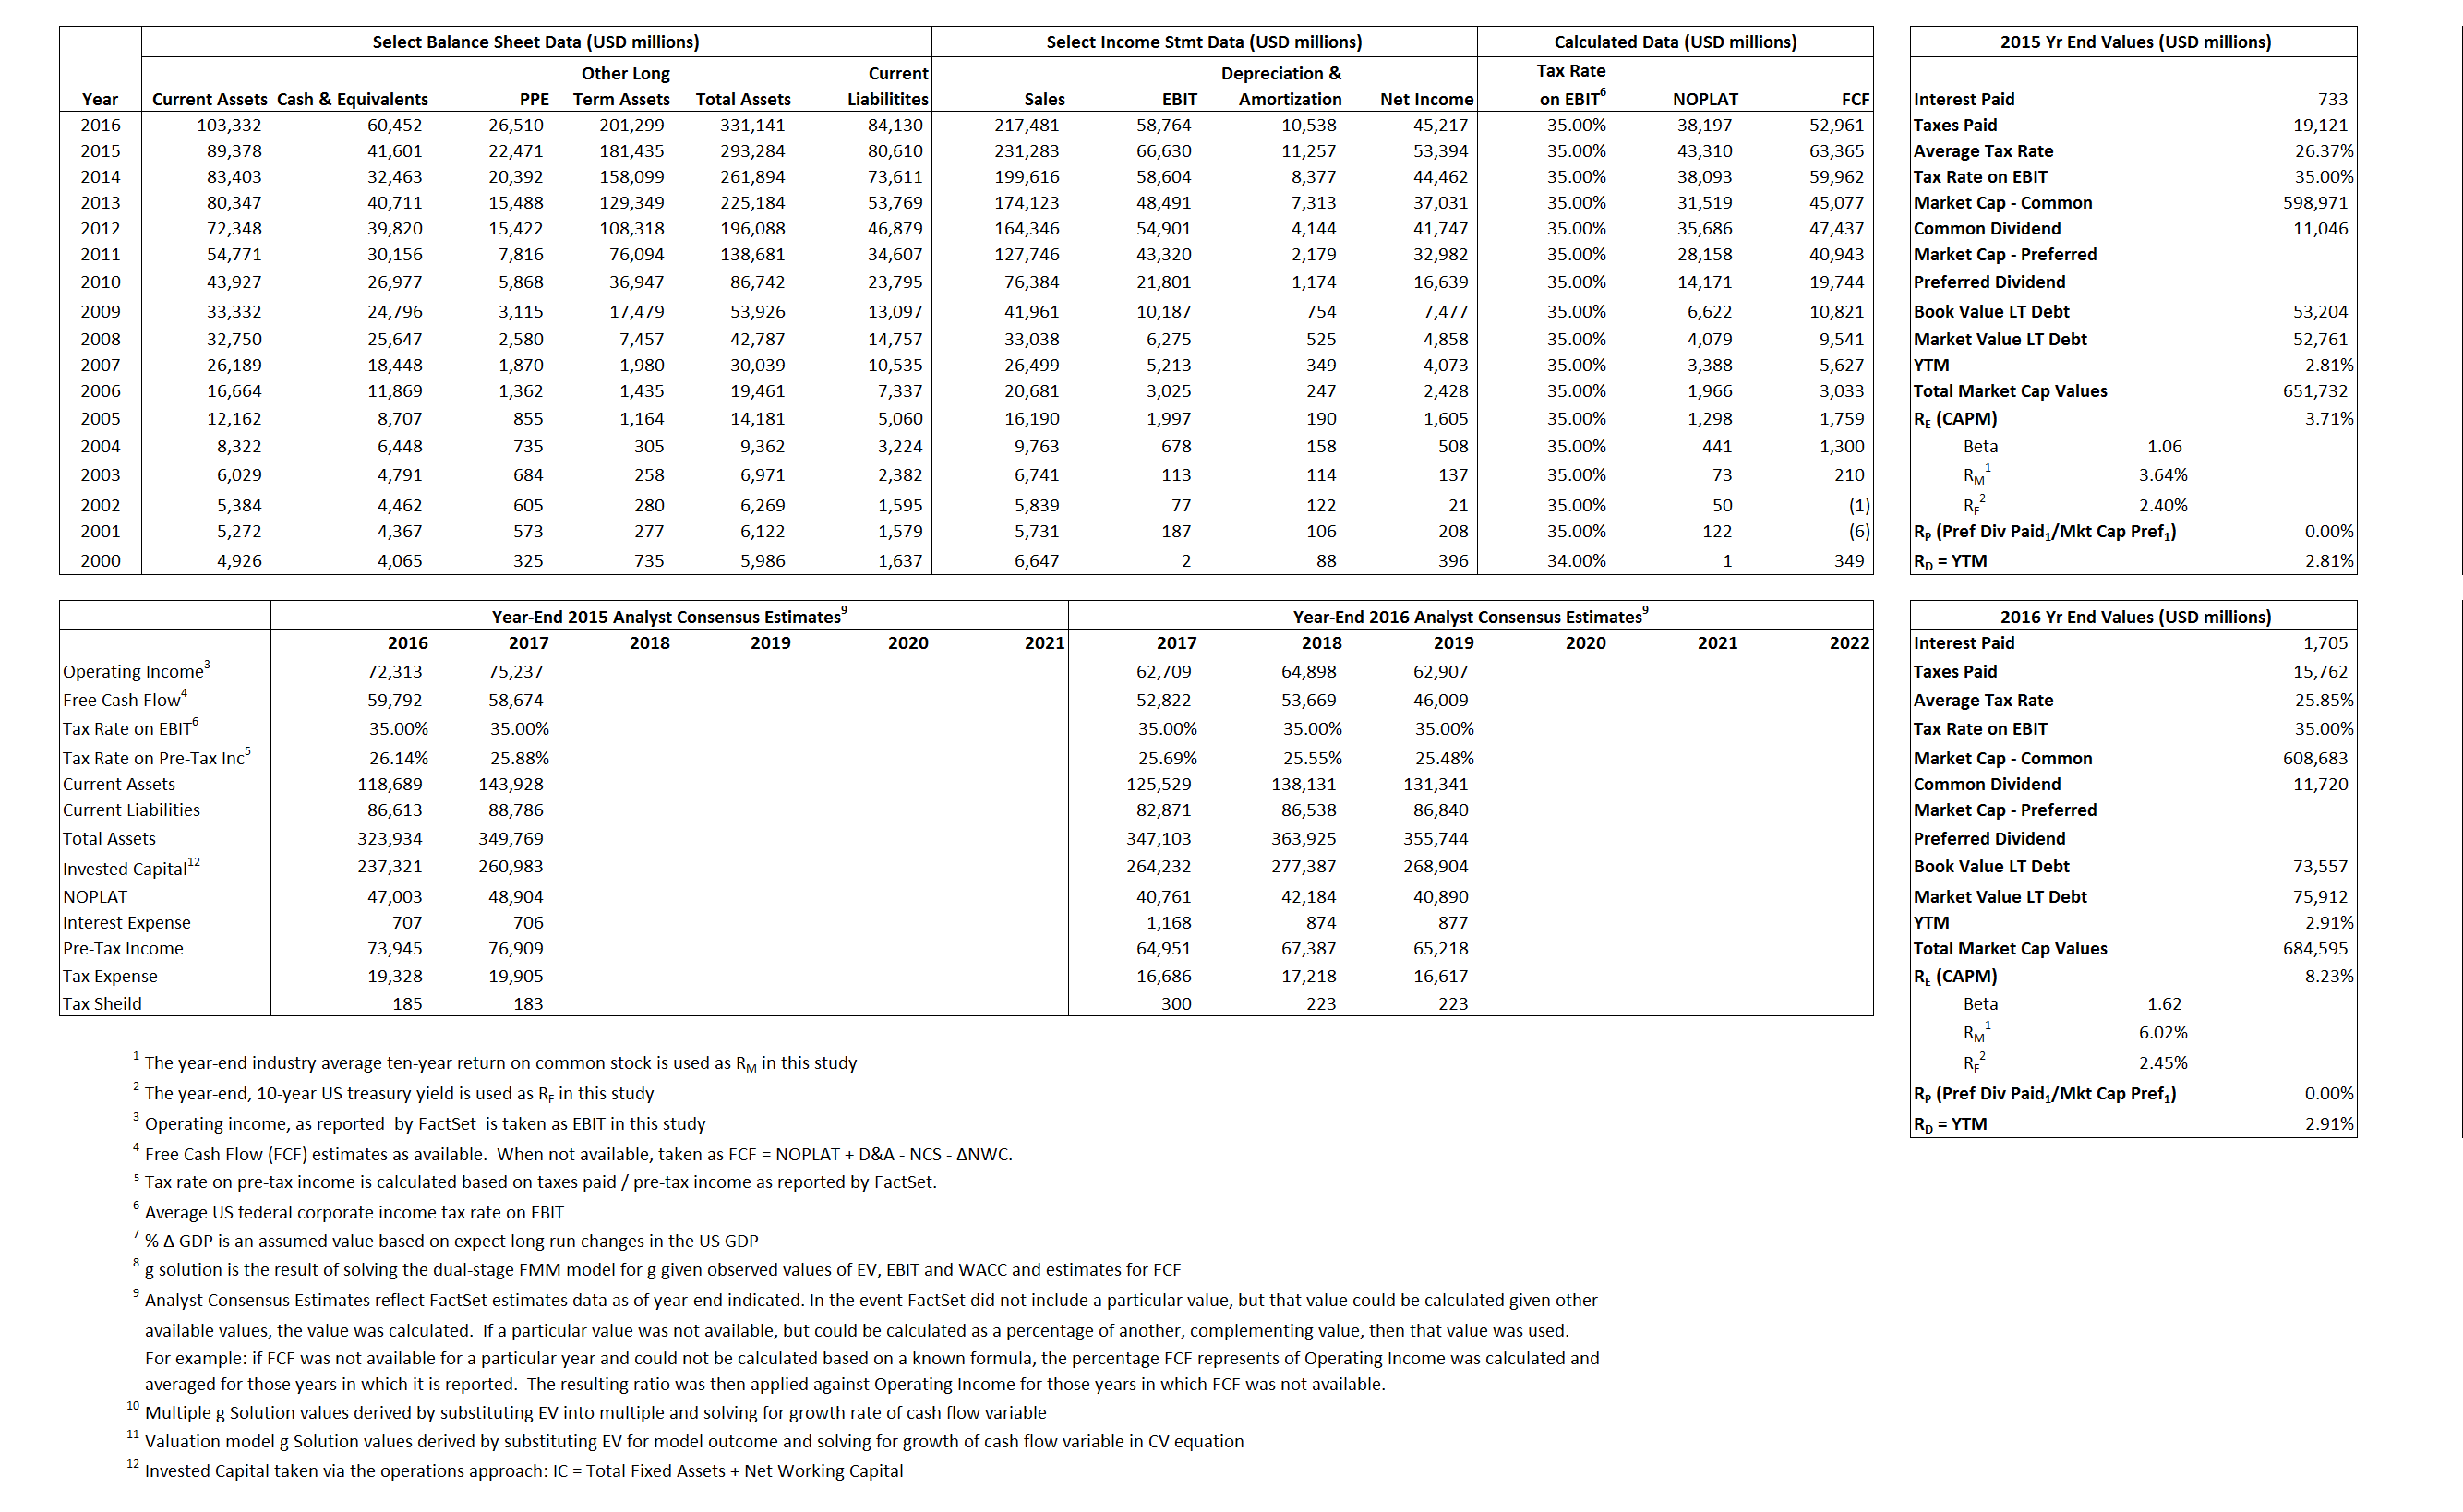
Derived Input Data
Derived Input |
Label |
2015 Value |
2016
|
Equational Form |
| Net Operating Profit Less Adjusted Taxes | NOPLAT | 43,310 | 38,197 |  |
| Free Cash Flow | FCF | 63,365 | 52,961 |  |
| Tax Shield | TS | 193 | 441 |  |
| Invested Capital | IC | 212,674 | 247,011 |  |
| Return on Invested Capital | ROIC | 20.36% | 15.46% |  |
| Net Investment | NetInv | 35,648 | 44,875 |  |
| Investment Rate | IR | 82.31% | 117.48% |  |
| Weighted Average Cost of Capital |
WACCMarket | 3.58% | 7.56% |  |
| WACCBook | 9.44% | 9.15% | ||
| Enterprise value |
EVMarket | 610,131 | 624,143 |  |
| EVBook | 610,574 | 621,788 | ||
| Long-Run Growth |
g = IR x ROIC |
16.76% | 18.17% | Long-run growth rates of the income variable are used in the Continuing Value portion of the valuation models. |
g = %  GDP GDP |
2.50% | 2.50% | ||
| Margin from Operations | M | 28.81% | 27.02% |  |
| Depreciation/Amortization Rate | D | 14.45% | 15.21% |  |
Valuation Multiple Outcomes
The outcomes presented in this study are the result of original input data, derived data, and synthesized inputs.
Equational Form |
Observed Value |
Single-stagemultiple g solution |
Two-stage valuationmodel g solution |
|||
| 12/31/2015 | 12/31/2016 | 12/31/2015 | 12/31/2016 | 12/31/2015 | 12/31/2016 | |
|
|
2.64 |
2.87 | -5.40% | 2.38% | -7.53% | 3.87% |
|
|
7.83 | 9.01 | -5.40% | 2.38% | -7.53% | 3.87% |
|
|
14.09 |
16.34 | -5.40% | 2.38% | -7.53% | 3.87% |
|
|
9.63 |
11.78 | -5.40% | 2.38% | -7.53% | 3.87% |
|
|
9.16 | 10.62 | -5.40% | 2.38% | -7.53% | 3.87% |
|
|
2.87 |
2.53 | -5.40% | 2.38% | -7.53% | 3.87% |


