Walt Disney Company
Analyst Listing
The following analysts provide coverage for the subject firm as of May 2016:
| Broker | Analyst | Analyst Email |
| JBL Advisors | Jeffrey B. Logsdon | jeff@jbladvisors.com |
| Topeka Capital Markets | David W. Miller | dwm@topekacapitalmarkets.com |
| Drexel Hamilton | Tony Wible | twible@drexelhamilton.com |
| Evercore ISI | Vijay Jayant | vijay.jayant@evercoreisi.com |
| Pivotal Research Group | Brian Wieser | brian@pvtl.com |
| Guggenheim Securities | Michael C. Morris | michael.morris@guggenheimpartners.com |
| RBC Capital Markets | Steven Cahall | steven.cahall@rbccm.com |
| Atlantic Equities | Hamiton Faber | h.faber@altantic-equities.com |
| Cowen & Company | Doug Creutz | doug.creutz@cowen.com |
| Wells Fargo Securities | Marci Ryvicker | marci.ryvicker@wellsfargo.com |
| Piper Jaffray | Stan Meyers | stan.x.meyers@pjc.com |
| Stifel Nicolaus | Benjamin E. Mogil | bmogil@stifel.com |
| FBR Capital Markets & Co | Barton Crockett | bcrockett@fbr.com |
| Jefferies | John Janedis | jjanedis@jefferies.com |
| Needham | Laura Martin | lmartin@needhamco.com |
| BMO Capital Markets | Daniel Salmon | dan.salmon@bmo.com |
| Nomura Research | Anthony DiClemente | anthony.diclemente@nomura.com |
| Credit Suisse | Omar Sheikh | omar.sheikh@credit-suisse.com |
| Deutsche Bank Research | Bryan Kraft | bryan.kraft@db.com |
| Bernstein Research | Todd Juenger | todd.juenger@bernstein.com |
| Hilliard Lyons | Jeffrey S. Thomison | jthomison@hilliard.com |
| Rosenblatt Securities | Martin Pyykkonen | mpyykkonen@rbit.com |
Primary Input Data
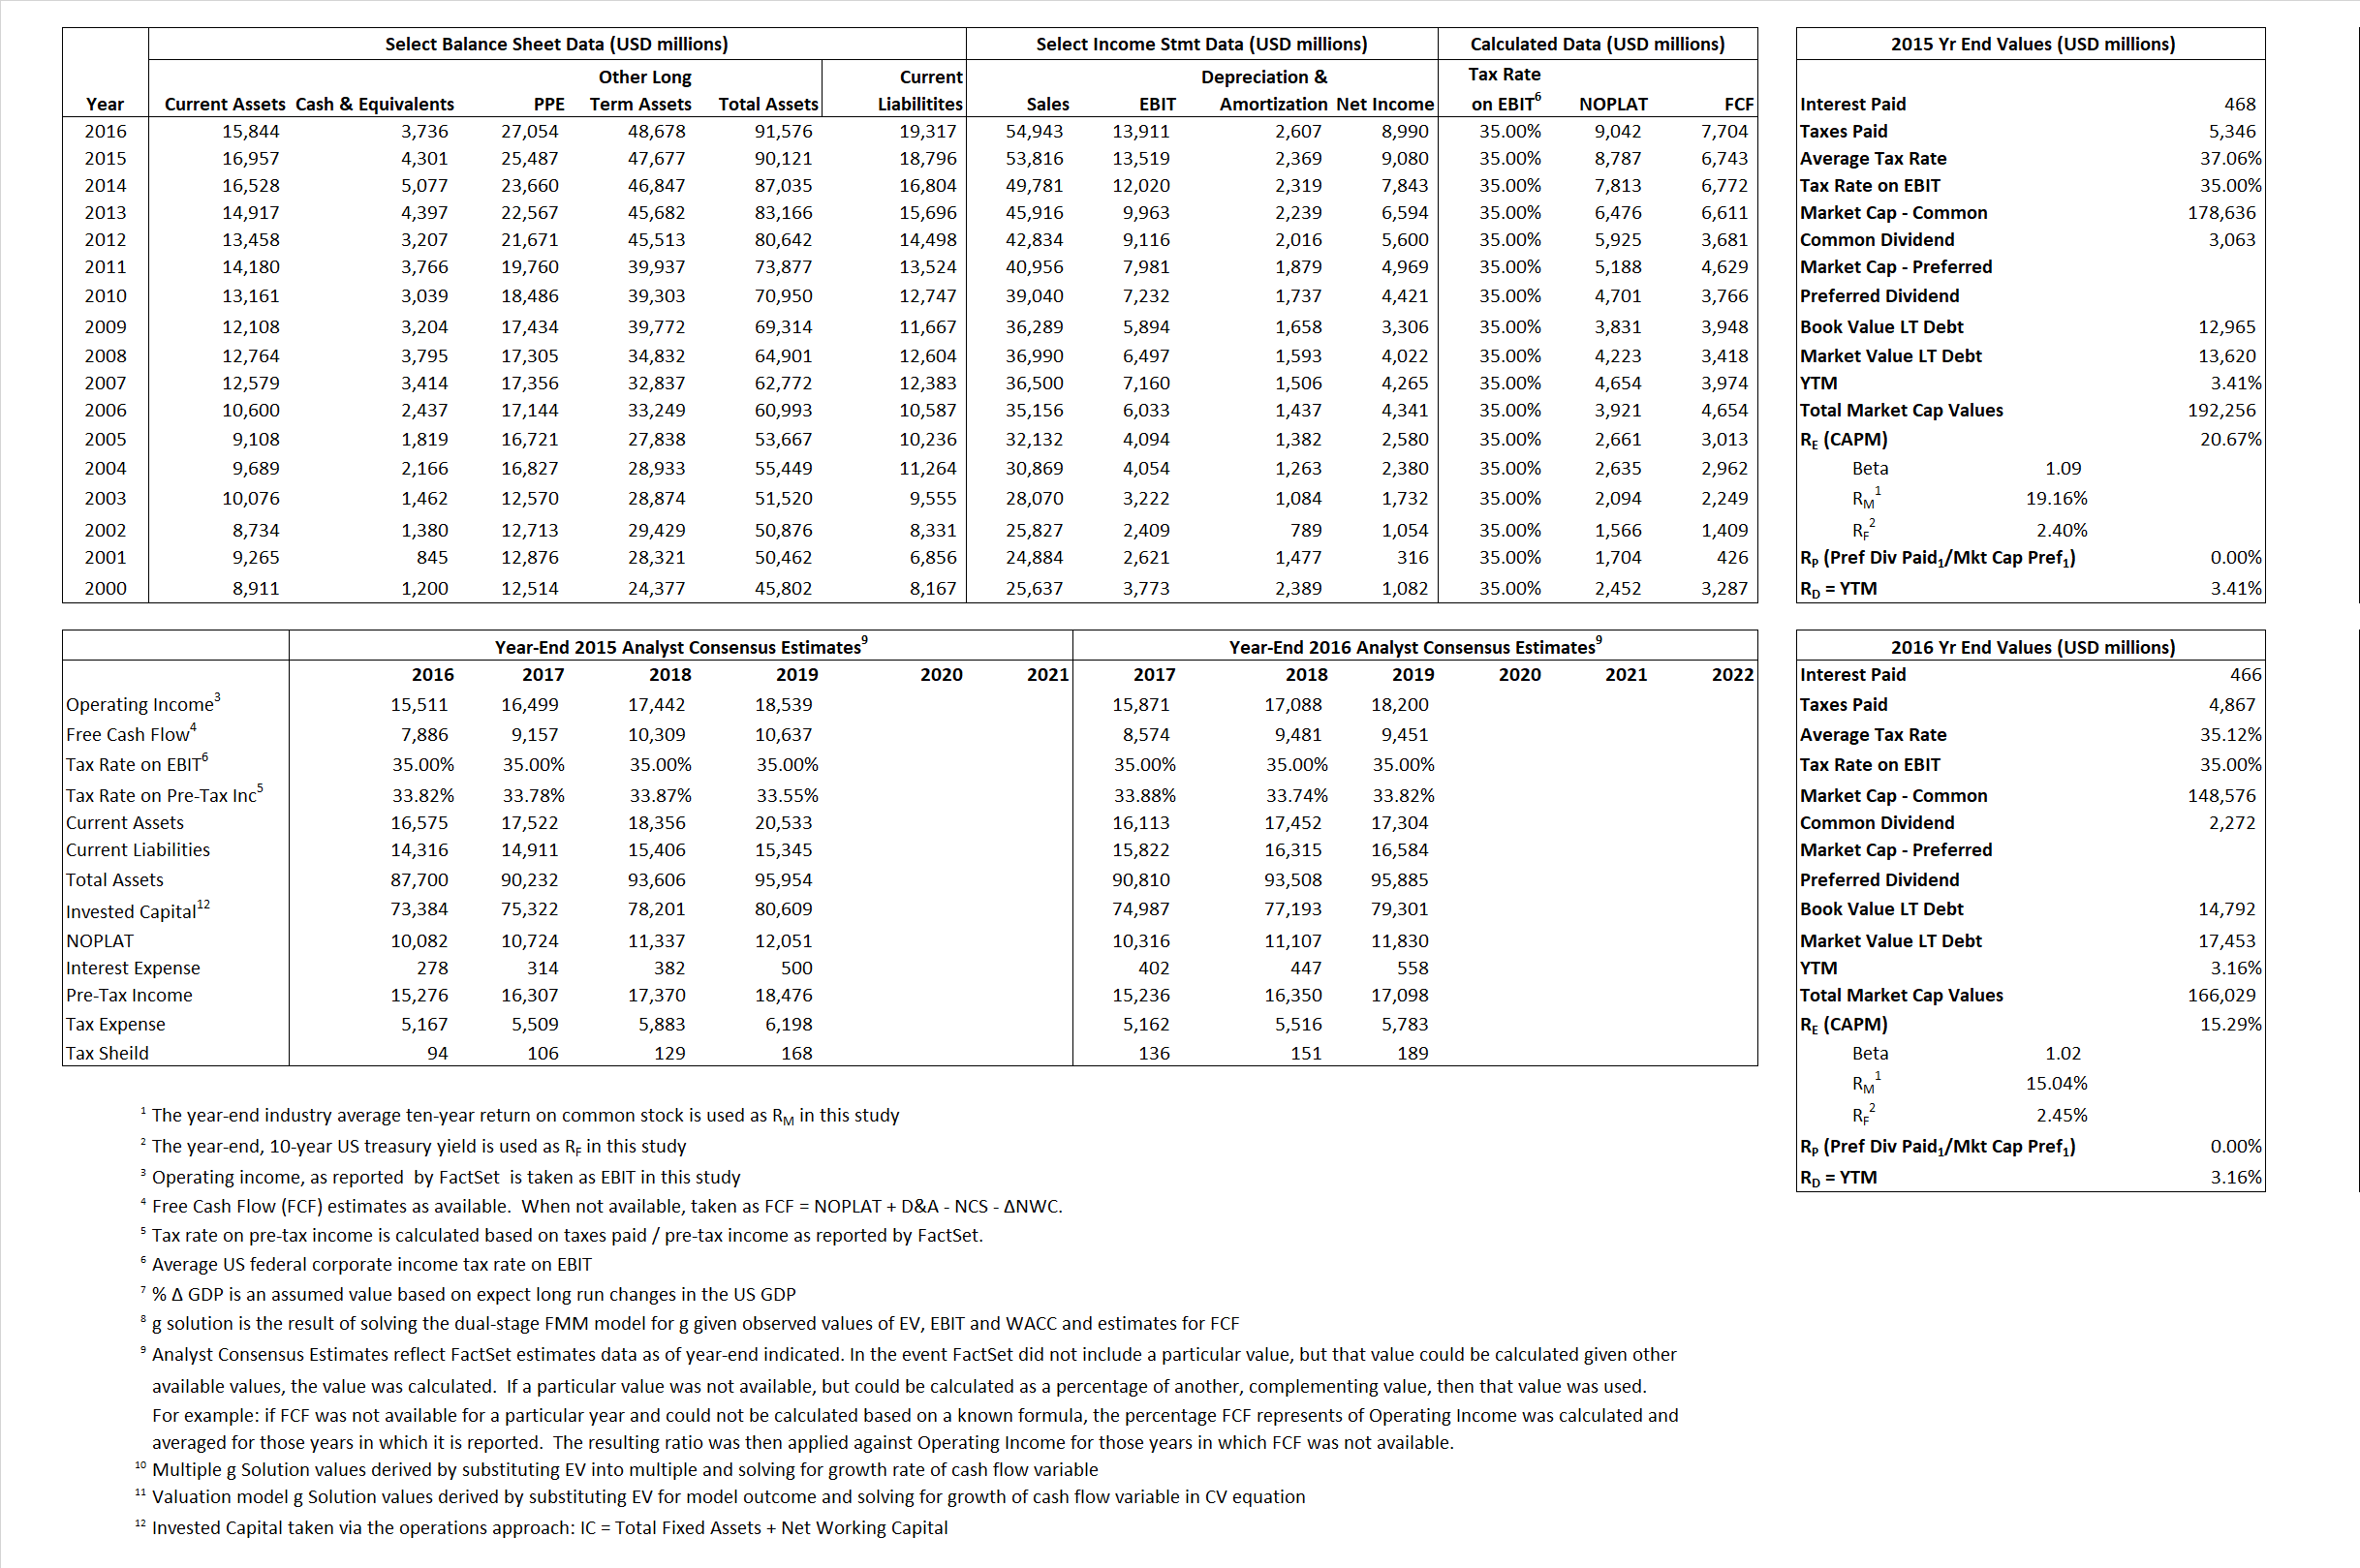
Derived Input Data
Derived Input |
Label |
2015 Value |
2016
|
Equational Form |
| Net Operating Profit Less Adjusted Taxes | NOPLAT | 8,787 | 9,042 |  |
| Free Cash Flow | FCF | 6,743 | 7,704 |  |
| Tax Shield | TS | 173 | 164 |  |
| Invested Capital | IC | 71,325 | 72,259 |  |
| Return on Invested Capital | ROIC | 12.32% | 12.51% |  |
| Net Investment | NetInv | 3,463 | 3,541 |  |
| Investment Rate | IR | 39.41% | 39.16% |  |
| Weighted Average Cost of Capital |
WACCMarket | 19.36% | 13.90% |  |
| WACCBook | 8.99% | 8.55% | ||
| Enterprise value |
EVMarket | 187,955 | 162,293 |  |
| EVBook | 187,300 | 159,632 | ||
| Long-Run Growth |
g = IR x ROIC |
4.86% | 4.90% | Long-run growth rates of the income variable are used in the Continuing Value portion of the valuation models. |
g = %  GDP GDP |
2.50% | 2.50% | ||
| Margin from Operations | M | 25.12% | 25.32% |  |
| Depreciation/Amortization Rate | D | 14.91% | 15.78% |  |
Valuation Multiple Outcomes
The outcomes presented in this study are the result of original input data, derived data, and synthesized inputs.
Equational Form |
Observed Value |
Single-stagemultiple g solution |
Two-stage valuationmodel g solution |
|||
| 12/31/2015 | 12/31/2016 | 12/31/2015 | 12/31/2016 | 12/31/2015 | 12/31/2016 | |
|
|
3.49 | 2.95 | 23.66% | 15.01% | 21.28% | 14.50% |
|
|
11.83 | 9.83 | 23.66% | 15.01% | 21.28% | 14.50% |
|
|
21.39 | 17.95 | 23.66% | 15.01% | 21.28% | 14.50% |
|
|
27.87 | 21.07 | 23.66% | 15.01% | 21.28% | 14.50% |
|
|
13.90 | 11.67 | 23.66% | 15.01% | 21.28% | 14.50% |
|
|
2.64 | 2.25 | 23.66% | 15.01% | 21.28% | 14.50% |


