Johnson & Johnson
Analyst Listing
The following analysts provide coverage for the subject firm as of May 2016:
| Broker | Analyst | Analyst Email |
| Morningstar | Damien Conover | damien.conover@morningstar.com |
| BTIG | Dane Leone | dleone@btig.com |
| Leerink Partners | Danielle Antalffy | danielle.antalffy@leerink.com |
| Argus Research | David Toung | dtoung@argusresearch.com |
| Societe Generale | Florent Cespedes | florent.cespedes@sgcib.com |
| RBC Capital Markets | Glenn Novarro | glenn.novarro@rbccm.com |
| Raymond James | Jayson Bedford | jayson.bedford@raymondjames.com |
| Jefferies | Jeffrey Holford | jholford@jefferies.com |
| BMO Capital Markets | Joanne K. Wuensch | joanne.wuensch@bmo.com |
| Cowen & Company | Joshua Jennings | josh.jennings@cowen.com |
| Deutsche Bank Research | Kristen Stewart | kristen.stewart@db.com |
| Wells Fargo Securities | Larry Biegelsen | lawrence.biegelsen@wellsfargo.com |
| Piper Jaffray | Richard J. Purkiss | richard.j.purkiss@pjc.com |
| Stifel Nicolaus | Rick Wise | danielle.antalffy@leerink.com |
| Erste Group | Stephan Lingnau | stephan.lingnau@erstegroup.com |
| Atlantic Equities | Steve Chesney | s.chesney@atlantic-equities.com |
| Guggenheim Securities | Tony Butler | tony.butler@guggenheimpartners.com |
| Credit Suisse | Vamil Divan | vamil.divan@credit-suisse.com |
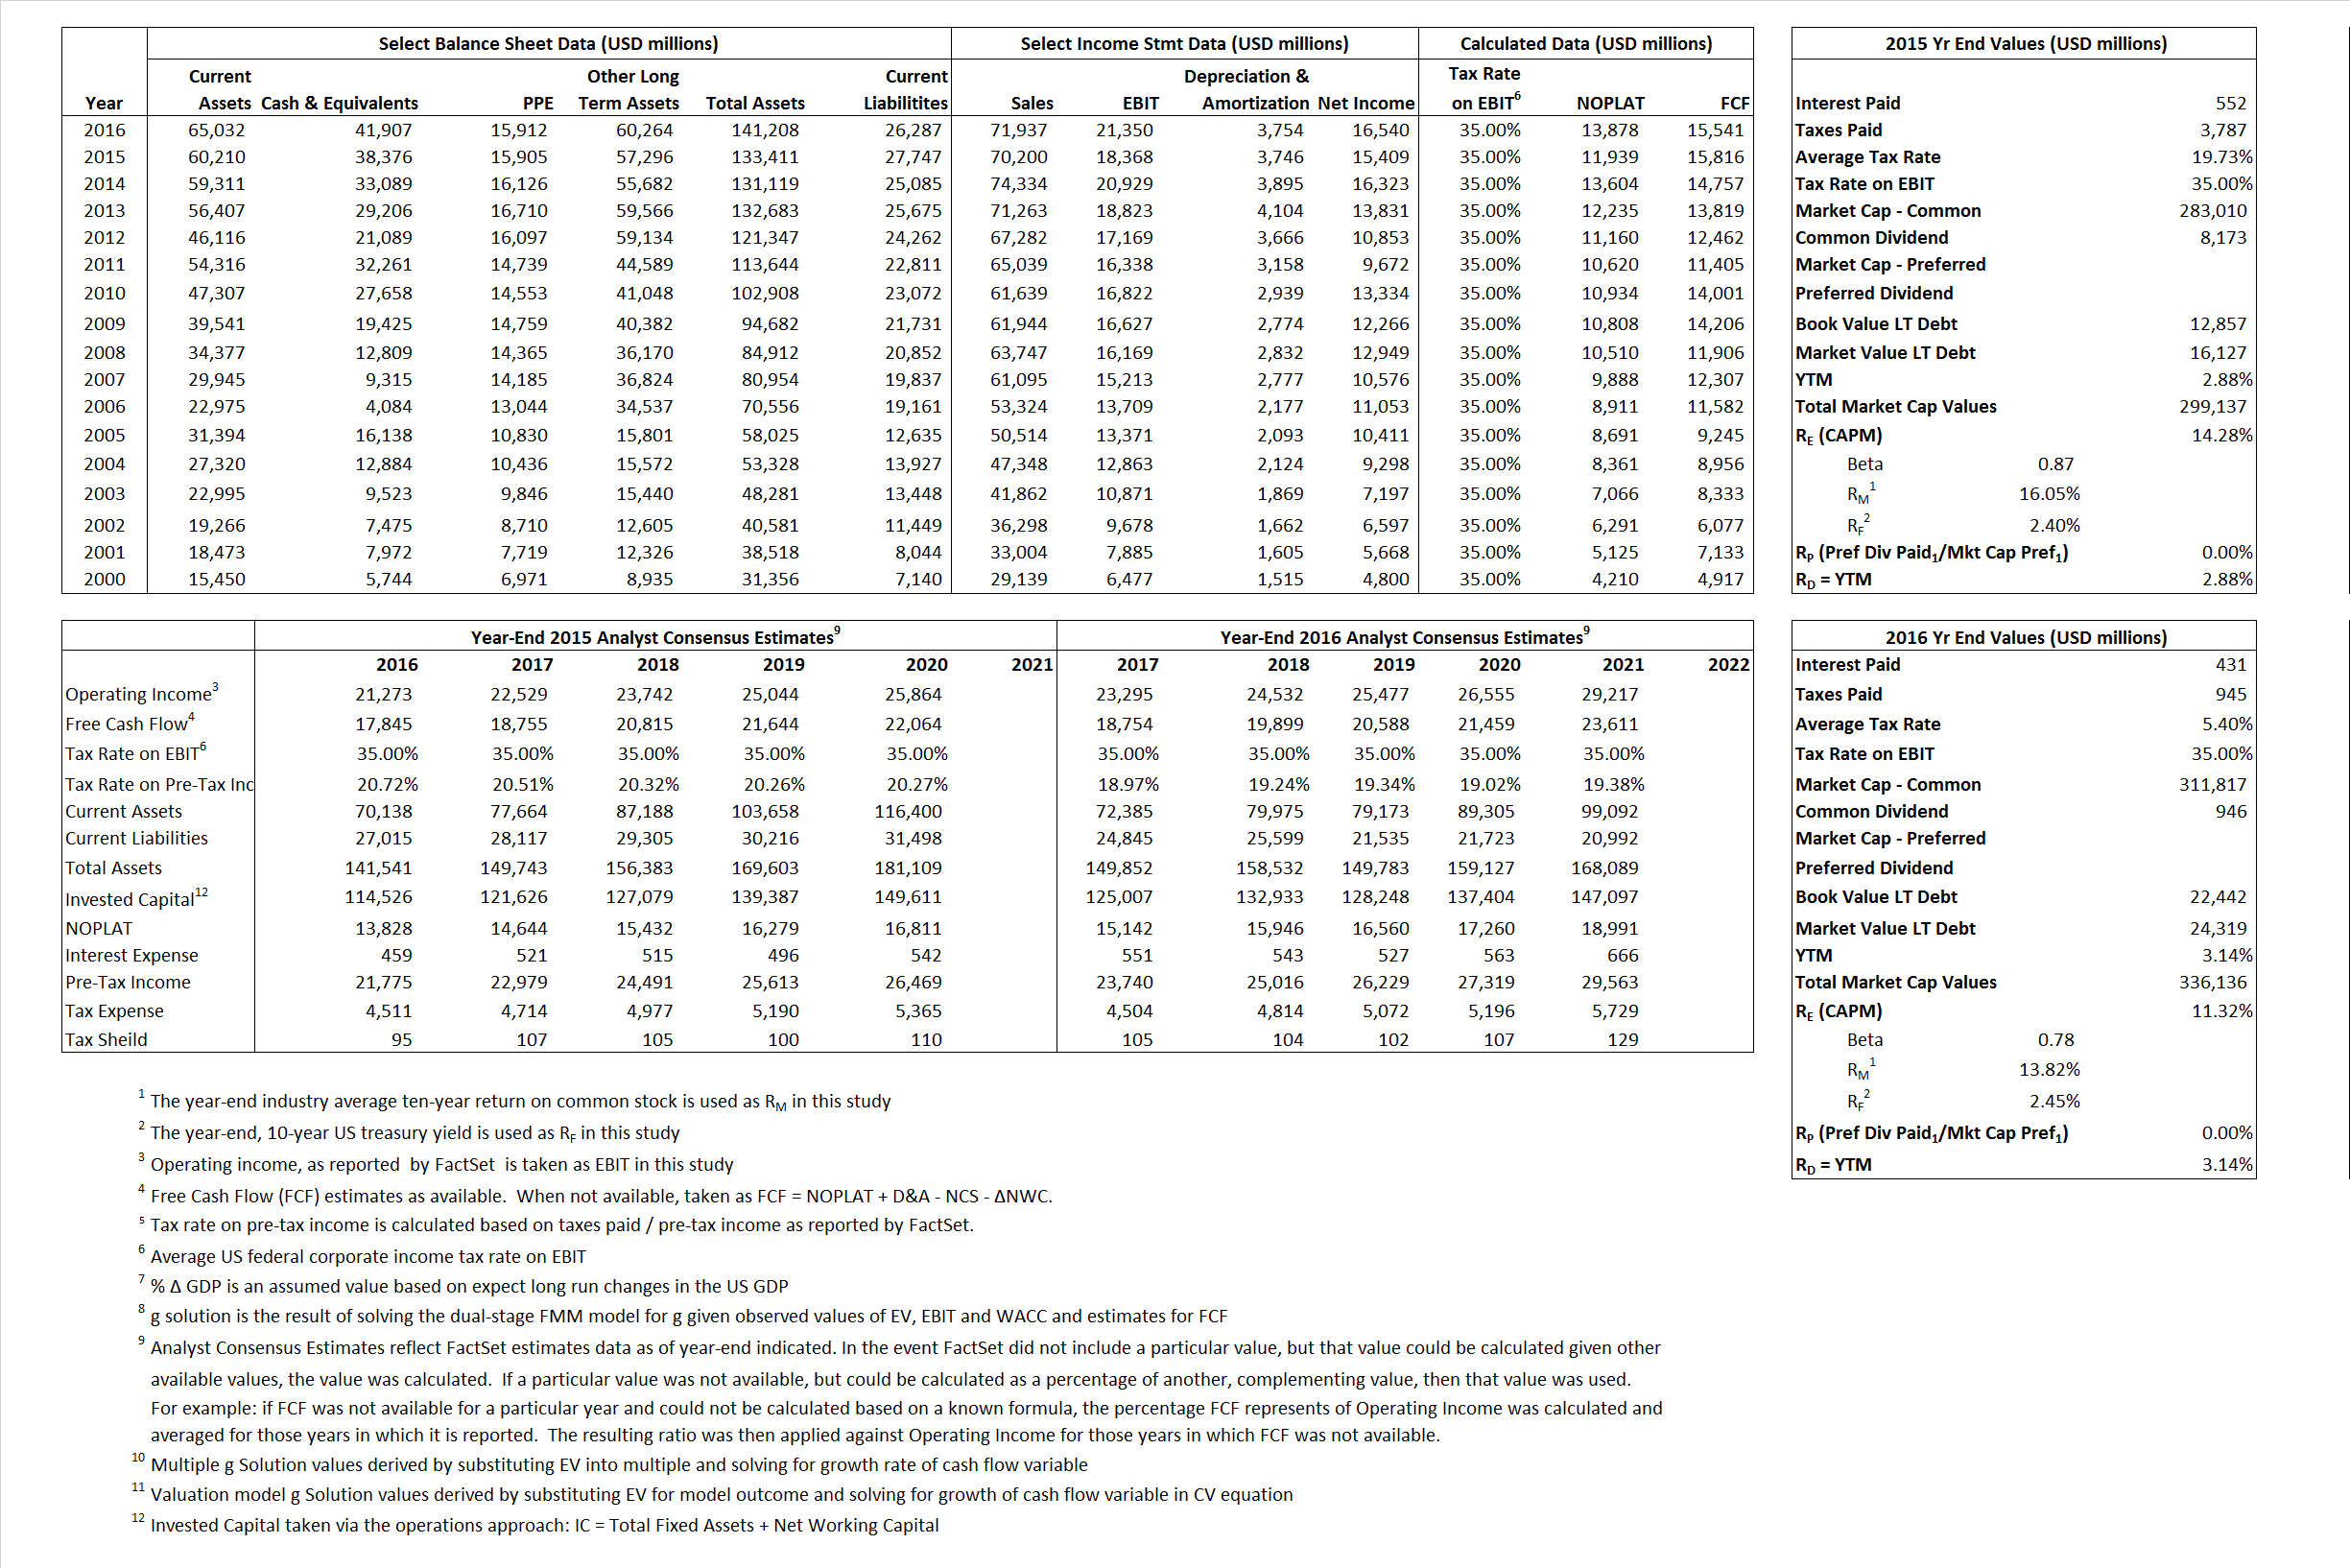
Primary Input Data
Derived Input Data
Derived Input |
Label |
2015 Value |
2016
|
Equational Form |
| Net Operating Profit Less Adjusted Taxes | NOPLAT | 11,939 | 13,878 |  |
| Free Cash Flow | FCF | 15,816 | 15,541 |  |
| Tax Shield | TS | 109 | 23 |  |
| Invested Capital | IC | 105,664 | 114,921 |  |
| Return on Invested Capital | ROIC | 11.30% | 12.08% |  |
| Net Investment | NetInv | 3,376 | 13,011 |  |
| Investment Rate | IR | 28.28% | 93.76% |  |
| Weighted Average Cost of Capital |
WACCMarket | 13.63% | 10.71% |  |
| WACCBook | 8.01% | 7.10% | ||
| Enterprise value |
EVMarket | 260,761 | 294,229 |  |
| EVBook | 253,960 | 292,352 | ||
| Long-Run Growth |
g = IR x ROIC |
3.20% | 11.32% | Long-run growth rates of the income variable are used in the Continuing Value portion of the valuation models. |
g = %  GDP GDP |
2.50% | 2.50% | ||
| Margin from Operations | M | 26.17% | 29.68% |  |
| Depreciation/Amortization Rate | D | 16.94% | 14.95% |  |
Valuation Multiple Outcomes
The outcomes presented in this study are the result of original input data, derived data, and synthesized inputs.
Equational Form |
Observed Value |
Single-stagemultiple g solution |
Two-stage valuationmodel g solution |
|||
| 12/31/2015 | 12/31/2016 | 12/31/2015 | 12/31/2016 | 12/31/2015 | 12/31/2016 | |
|
|
3.71 | 4.09 | 15.22% | 9.84% | 14.59% | 10.30% |
|
|
11.79 | 11.72 | 15.22% | 9.84% | 14.59% | 10.30% |
|
|
21.84 | 21.20 | 15.22% | 9.84% | 14.59% | 10.30% |
|
|
16.49 | 18.93 | 15.22% | 9.84% | 14.59% | 10.30% |
|
|
14.20 | 13.78 | 15.22% | 9.84% | 14.59% | 10.30% |
|
|
2.47 | 2.56 | 15.22% | 9.84% | 14.59% | 10.30% |


