General Dynamics Corporation
Analyst Listing
The following analysts provide coverage for the subject firm as of May 2016:
| Broker | Analyst | Analyst Email |
| Deutsche Bank Research | Myles Walton | myles.walton@db.com |
| Wolfe Research | Hunter K. Keay | hkeay@wolferesearch.com |
| Credit Suisse | Robert Spingarn | robert.spingarn@credit-suisse.com |
| Guggenheim Securities | Roman Schweizer | roman.schweizer@guggenheimpartners.com |
| RBC Capital Markets | Robert Stallard | robert.stallard@rbccm.com |
| CRT Capital Group | Peter Arment | peter.arment@bernstein.com |
| Bernstein Research | Douglas S. Harned | douglas.harned@bernstein.com |
| Cowen & Company | Cai von Rumohr | cai.von-rumohr@cowen.com |
| Wells Fargo Securities | Sam J. Pearlstein | sam.pearlstein@wellsfargo.com |
| Stifel Nicolaus | Joseph W. DeNardi | denardij@stifel.com |
| Jefferies | Howard A. Rubel | hrubel@jefferies.com |
| Buckingham Research | Richard Safran | rsafran@buckresearch.com |
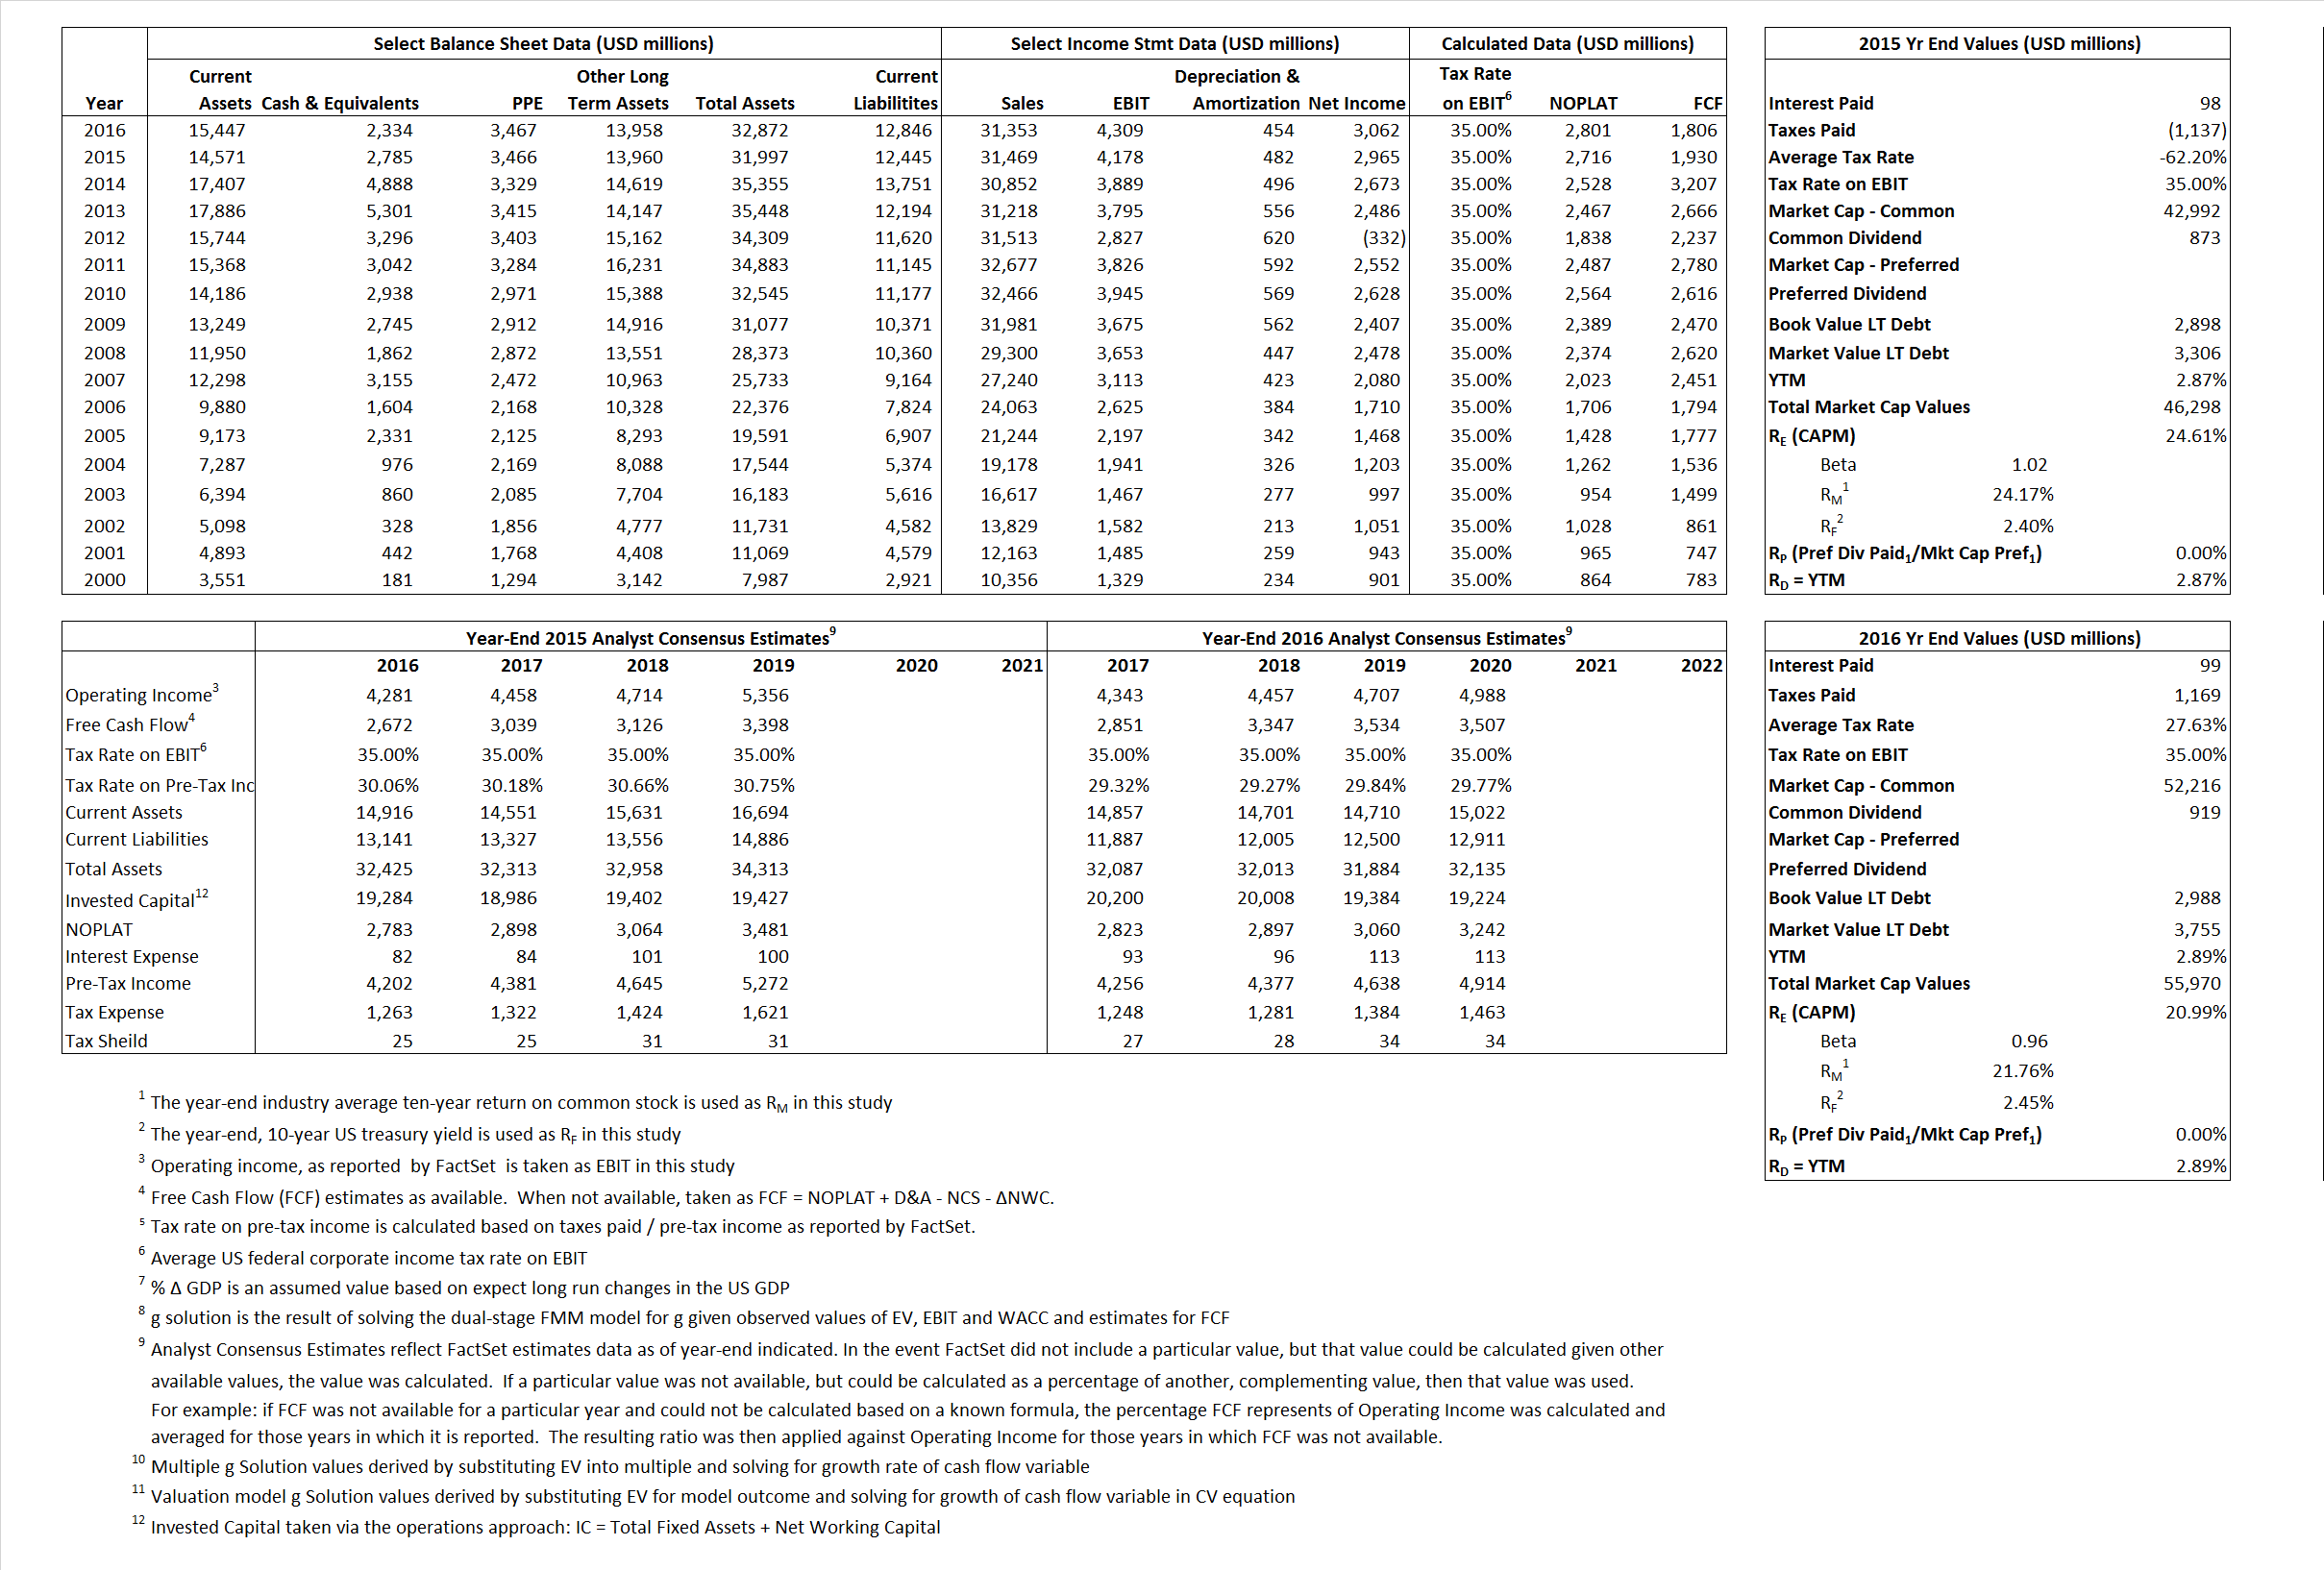
Primary Input Data
Derived Input Data
Derived Input |
Label |
2015 Value |
2016
|
Equational Form |
| Net Operating Profit Less Adjusted Taxes | NOPLAT | 2,716 | 2,801 |  |
| Free Cash Flow | FCF | 1,930 | 1,806 |  |
| Tax Shield | TS | (61) | 27 |  |
| Invested Capital | IC | 19,552 | 20,026 |  |
| Return on Invested Capital | ROIC | 13.89% | 13.99% |  |
| Net Investment | NetInv | (1,570) | 928 |  |
| Investment Rate | IR | -57.81% | 33.13% |  |
| Weighted Average Cost of Capital |
WACCMarket | 23.18% | 19.72% |  |
| WACCBook | 9.01% | 8.24% | ||
| Enterprise value |
EVMarket | 43,513 | 53,636 |  |
| EVBook | 43,105 | 52,870 | ||
| Long-Run Growth |
g = IR x ROIC |
-8.03% | 4.63% | Long-run growth rates of the income variable are used in the Continuing Value portion of the valuation models. |
g = %  GDP GDP |
2.50% | 2.50% | ||
| Margin from Operations | M | 13.28% | 13.74% |  |
| Depreciation/Amortization Rate | D | 10.34% | 9.53% |  |
Valuation Multiple Outcomes
The outcomes presented in this study are the result of original input data, derived data, and synthesized inputs.
Equational Form |
Observed Value |
Single-stagemultiple g solution |
Two-stage valuationmodel g solution |
|||
| 12/31/2015 | 12/31/2016 | 12/31/2015 | 12/31/2016 | 12/31/2015 | 12/31/2016 | |
|
|
1.38 | 1.71 | 30.76% | 23.14% | 26.03% | 20.99% |
|
|
9.34 | 11.26 | 30.76% | 23.14% | 26.03% | 20.99% |
|
|
16.02 | 19.15 | 30.76% | 23.14% | 26.03% | 20.99% |
|
|
22.55 | 29.70 | 30.76% | 23.14% | 26.03% | 20.99% |
|
|
10.41 | 12.45 | 30.76% | 23.14% | 26.03% | 20.99% |
|
|
2.23 | 2.26 | 30.76% | 23.14% | 26.03% | 20.99% |


