Halliburton
Analyst Listing
The following analysts provide coverage for the subject firm as of May 2016:
| Broker | Analyst | Analyst Email |
| Piper Jaffray | Bill Herbert | william.a.herbert@simmonspjc.com |
| Scotia Howard Weil | Bill Sanchez | william.sanchez@scotiabank.com |
| Jefferies | Brad Handler | brad.handler@jefferies.com |
| GMP Securities | Brian Uhlmer | buhlmer@gmpsecurities.com |
| Tudor Pickering Holt & Co. | Byron K. Pope | bpope@tudorpickering.com |
| Susquehanna Financial Group | Charles Minervino | charles.minervino@sig.com |
| BMO Capital Markets | Daniel Boyd | daniel.boyd@bmo.com |
| Johnson Rice & Company | Daniel Burke | dburke@jrco.com |
| KLR Group | Darren Gacicia | dfg@klrgroup.com |
| Societe Generale | Edward Muztafago | edward.muztafago@sgcib.com |
| Raymond James | J .Marshall Adkins | marshall.adkins@raymondjames.com |
| Evercore ISI | James West | james.west@evercoreisi.com |
| Credit Suisse | James Wicklund | james.wicklund@credit-suisse.com |
| Wells Fargo Securities | Judson E. Bailey | jud.bailey@wellsfargo.com |
| Seaport Global Securities | Ken Sill | ksill@seaportglobal.com |
| Griffin Securities | Kevin Simpson | ksimpson@griffinsecurities.com |
| RBC Capital Markets | Kurt Hallead | kurt.hallead@rbccm.com |
| Capital One Securities | Luke M. Lemoine | luke.lemoine@capitalone.com |
| Cowen & Company | Marc Bianchi | marc.bianchi@cowen.com |
| Nomura Research | Matthew Johnston | matthew.johnston@nomura.com |
| Stephens Inc | Matthew Marietta | matt.marietta@stephens.com |
| Guggenheim Securities | Michael LaMotte | michael.lamotte@guggenheimpartners.com |
| Deutsche Bank Research | Mike Urban | michael.urban@db.com |
| Clarksons Platou Securities | Nokta Haithum | haithum.nokta@clarksons.com |
| IBERIA Capital Partners | Robert Mackenzie | robert.mackenzie@iberiabank.com |
| KeyBanc Capital Markets | Robin Shoemaker | robin_shoemaker@key.com |
| DA Davidson | Sonny Randhawa | srandhawa@dadco.com |
| FBR Capital Markets & Co | Thomas Curran | tcurran@fbr.com |
Primary Input Data
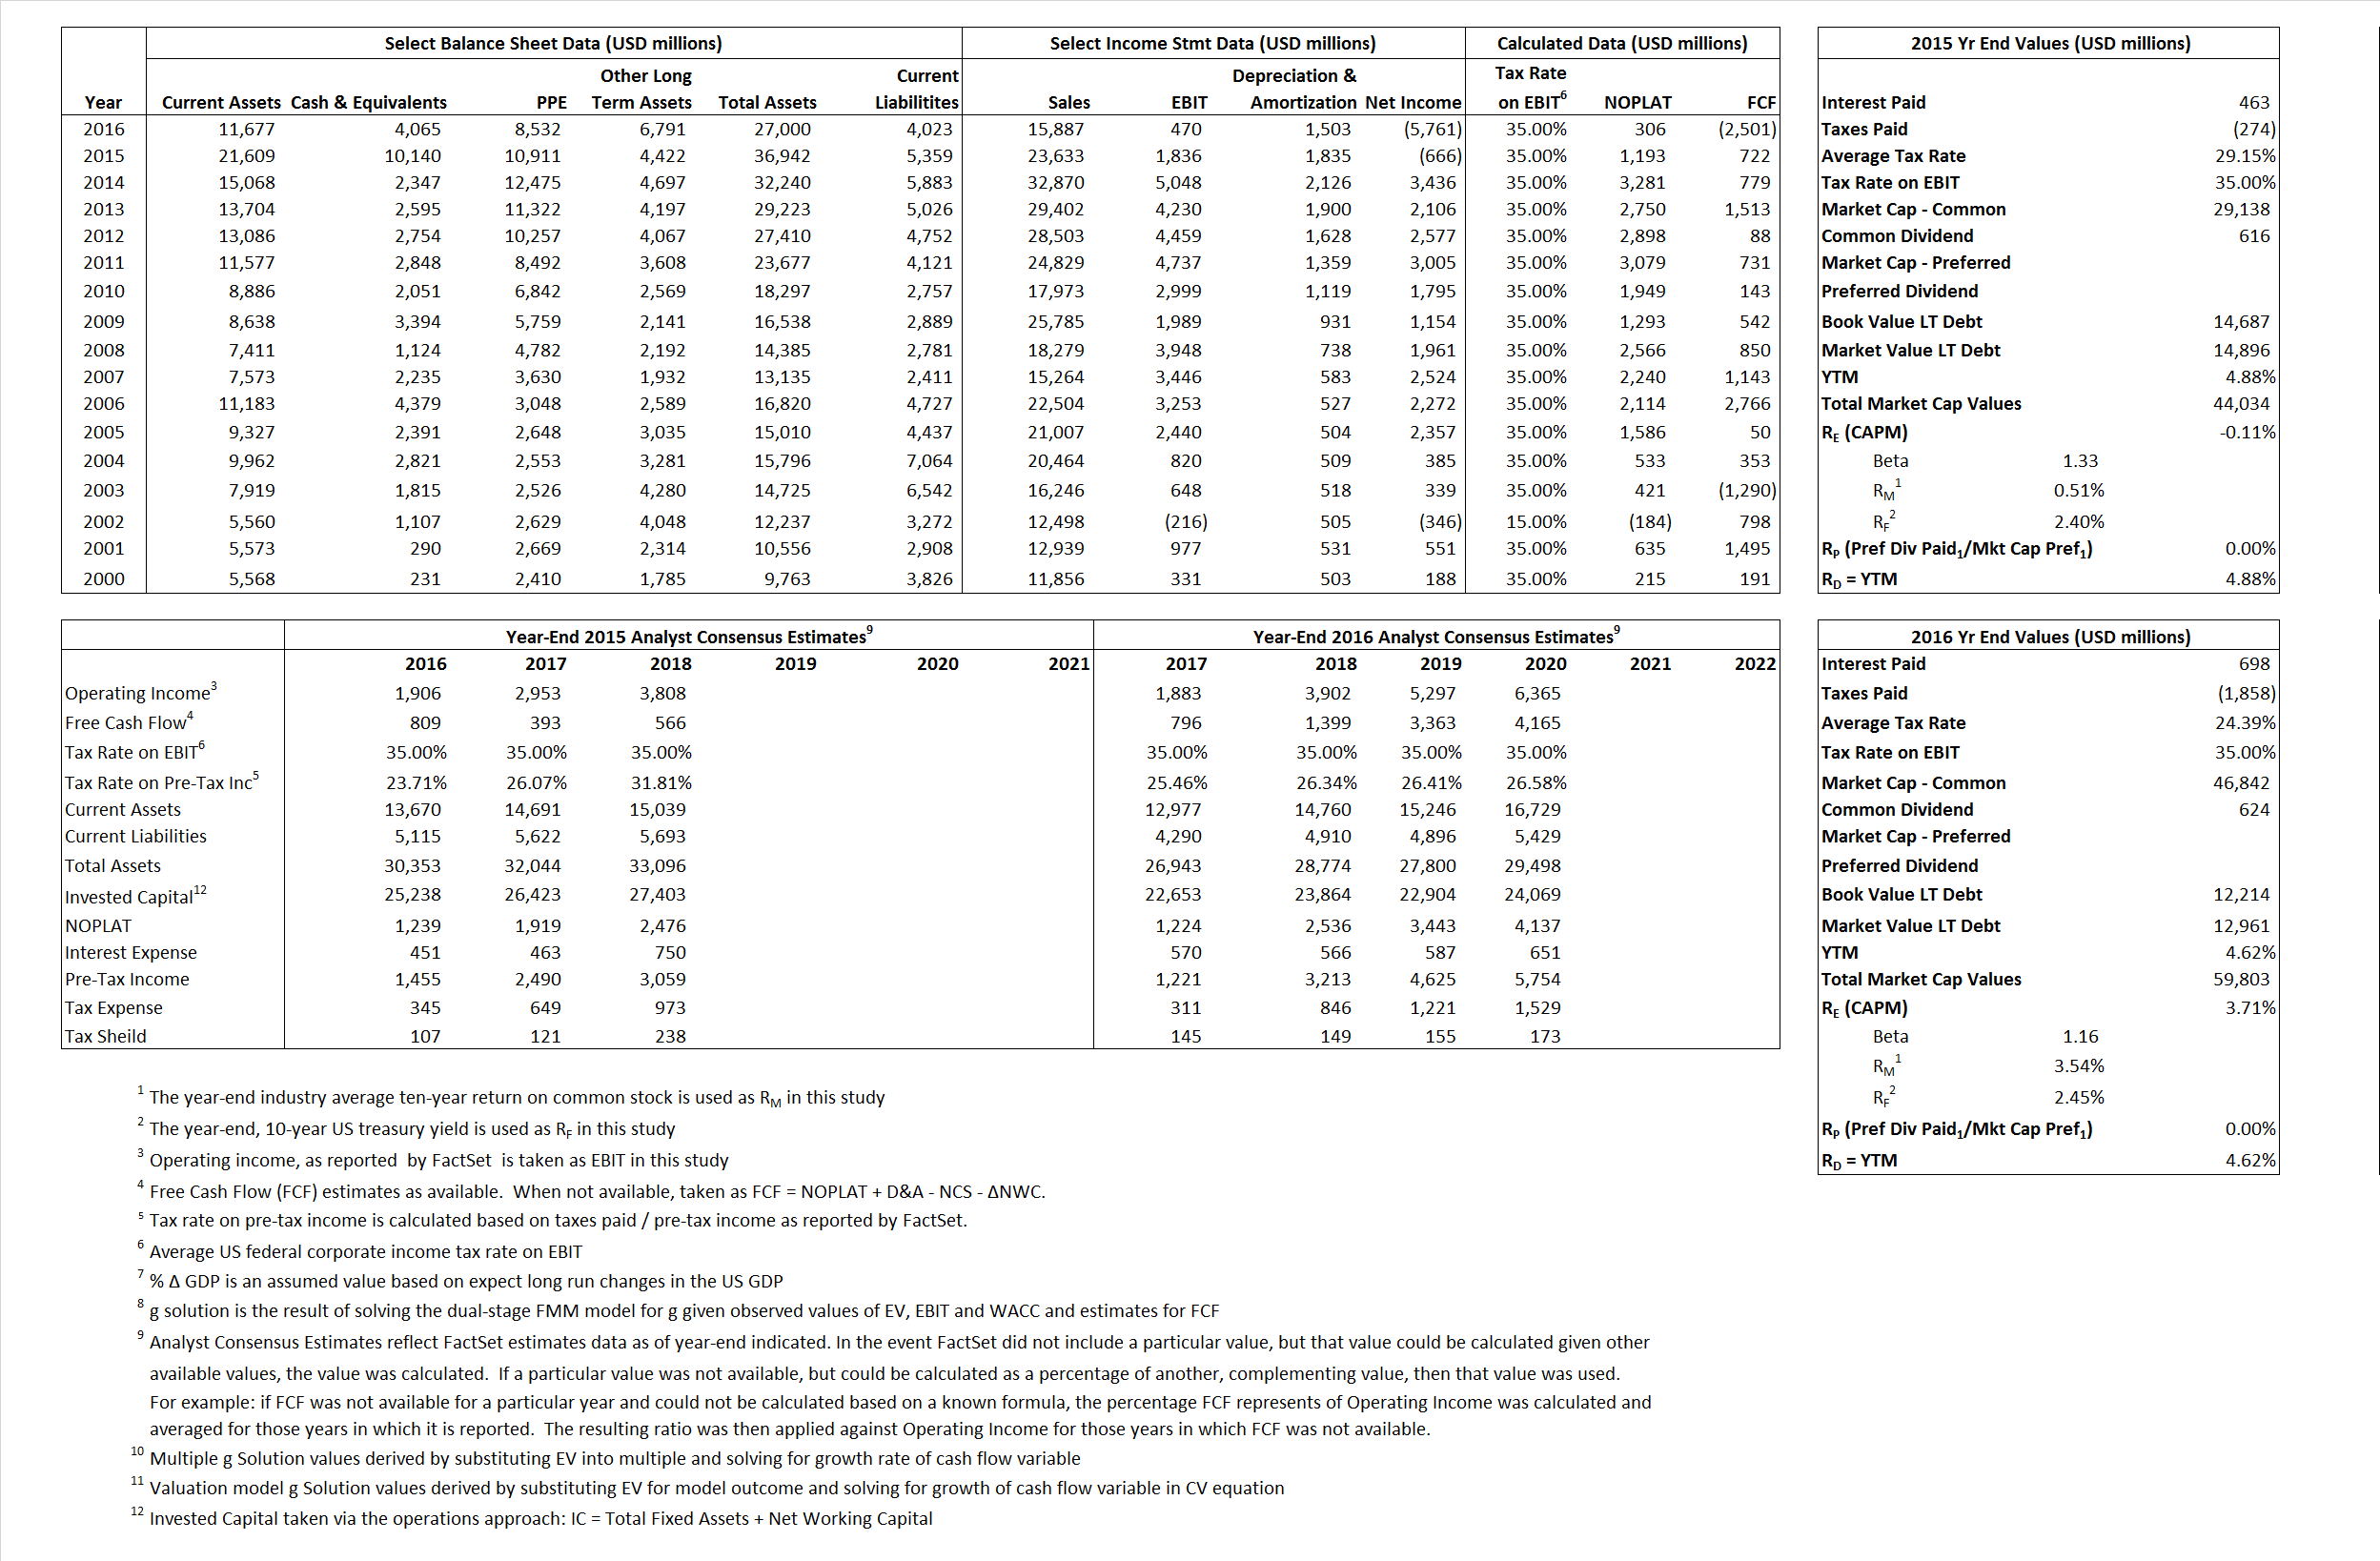
Derived Input Data
Derived Input |
Label |
2015 Value |
2016
|
Equational Form |
| Net Operating Profit Less Adjusted Taxes | NOPLAT | 1,193 | 306 |  |
| Free Cash Flow | FCF | 722 | (2,501) |  |
| Tax Shield | TS | 135 | 170 |  |
| Invested Capital | IC | 31,583 | 22,977 |  |
| Return on Invested Capital | ROIC | 3.78% | 1.33% |  |
| Net Investment | NetInv | 7,061 | (7,103) |  |
| Investment Rate | IR | 591.67% | -2,325.04% |  |
| Weighted Average Cost of Capital |
WACCMarket | 1.09% | 3.67% |  |
| WACCBook | 8.67% | 8.61% | ||
| Enterprise value |
EVMarket | 33,894 | 55,738 |  |
| EVBook | 33,685 | 54,991 | ||
| Long-Run Growth |
g = IR x ROIC |
22.36% | -30.91% | Long-run growth rates of the income variable are used in the Continuing Value portion of the valuation models. |
g = %  GDP GDP |
2.50% | 2.50% | ||
| Margin from Operations | M | 7.77% | 2.96% |  |
| Depreciation/Amortization Rate | D | 49.99% | 76.18% |  |
Valuation Multiple Outcomes
The outcomes presented in this study are the result of original input data, derived data, and synthesized inputs.
Equational Form |
Observed Value |
Single-stagemultiple g solution |
Two-stage valuationmodel g solution |
|||
| 12/31/2015 | 12/31/2016 | 12/31/2015 | 12/31/2016 | 12/31/2015 | 12/31/2016 | |
|
|
1.43 | 3.51 | -35.58% | 5.31% | -50.40% | 4.96% |
|
|
9.23 | 28.25 | 35.58% | 5.31% | -50.40% | 4.96% |
|
|
28.40 | 182.45 | 35.58% | 5.31% | -50.40% | 4.96% |
|
|
46.95 | -22.29 | 35.58% | 5.31% | -50.40% | 4.96% |
|
|
18.46 | 118.59 | 35.58% | 5.31% | -50.40% | 4.96% |
|
|
1.07 | 2.43 | 35.58% | 5.31% | -50.40% | 4.96% |


