Pfizer Inc
Analyst Listing
The following analysts provide coverage for the subject firm as of May 2016:
| Broker | Analyst | Analyst Email |
| BMO Capital Markets | Alex Arfaei | alex.arfaei@bmo.com |
| Deautche Bank Research | Gregg Gilbert | gregg.gilbert@db.com |
| SunTrust Robinson Humphrey | John T. Boris | john.t.boris@suntrust.com |
| Evercore ISI | Mark Schoenebaum | mark.schoenebaum@evercoreisi.com |
| Piper Jaffray | Richard J. Purkiss | richard.j.purkiss@pjc.com |
| Leerink Partners | Seamus Fernandez | seamus.fernandez@leerink.com |
| Atlantic Equities | Steve Chesney | s.chesney@atlantic-equities.com |
| Cowen & Company | Steve Scala | steve.scala@cowen.com |
| Bernstein Research | Tim Anderson | tim.anderson@bernstein.com |
| Credit Suisse | Vamil Divan | vamil.divan@credit-suisse.com |
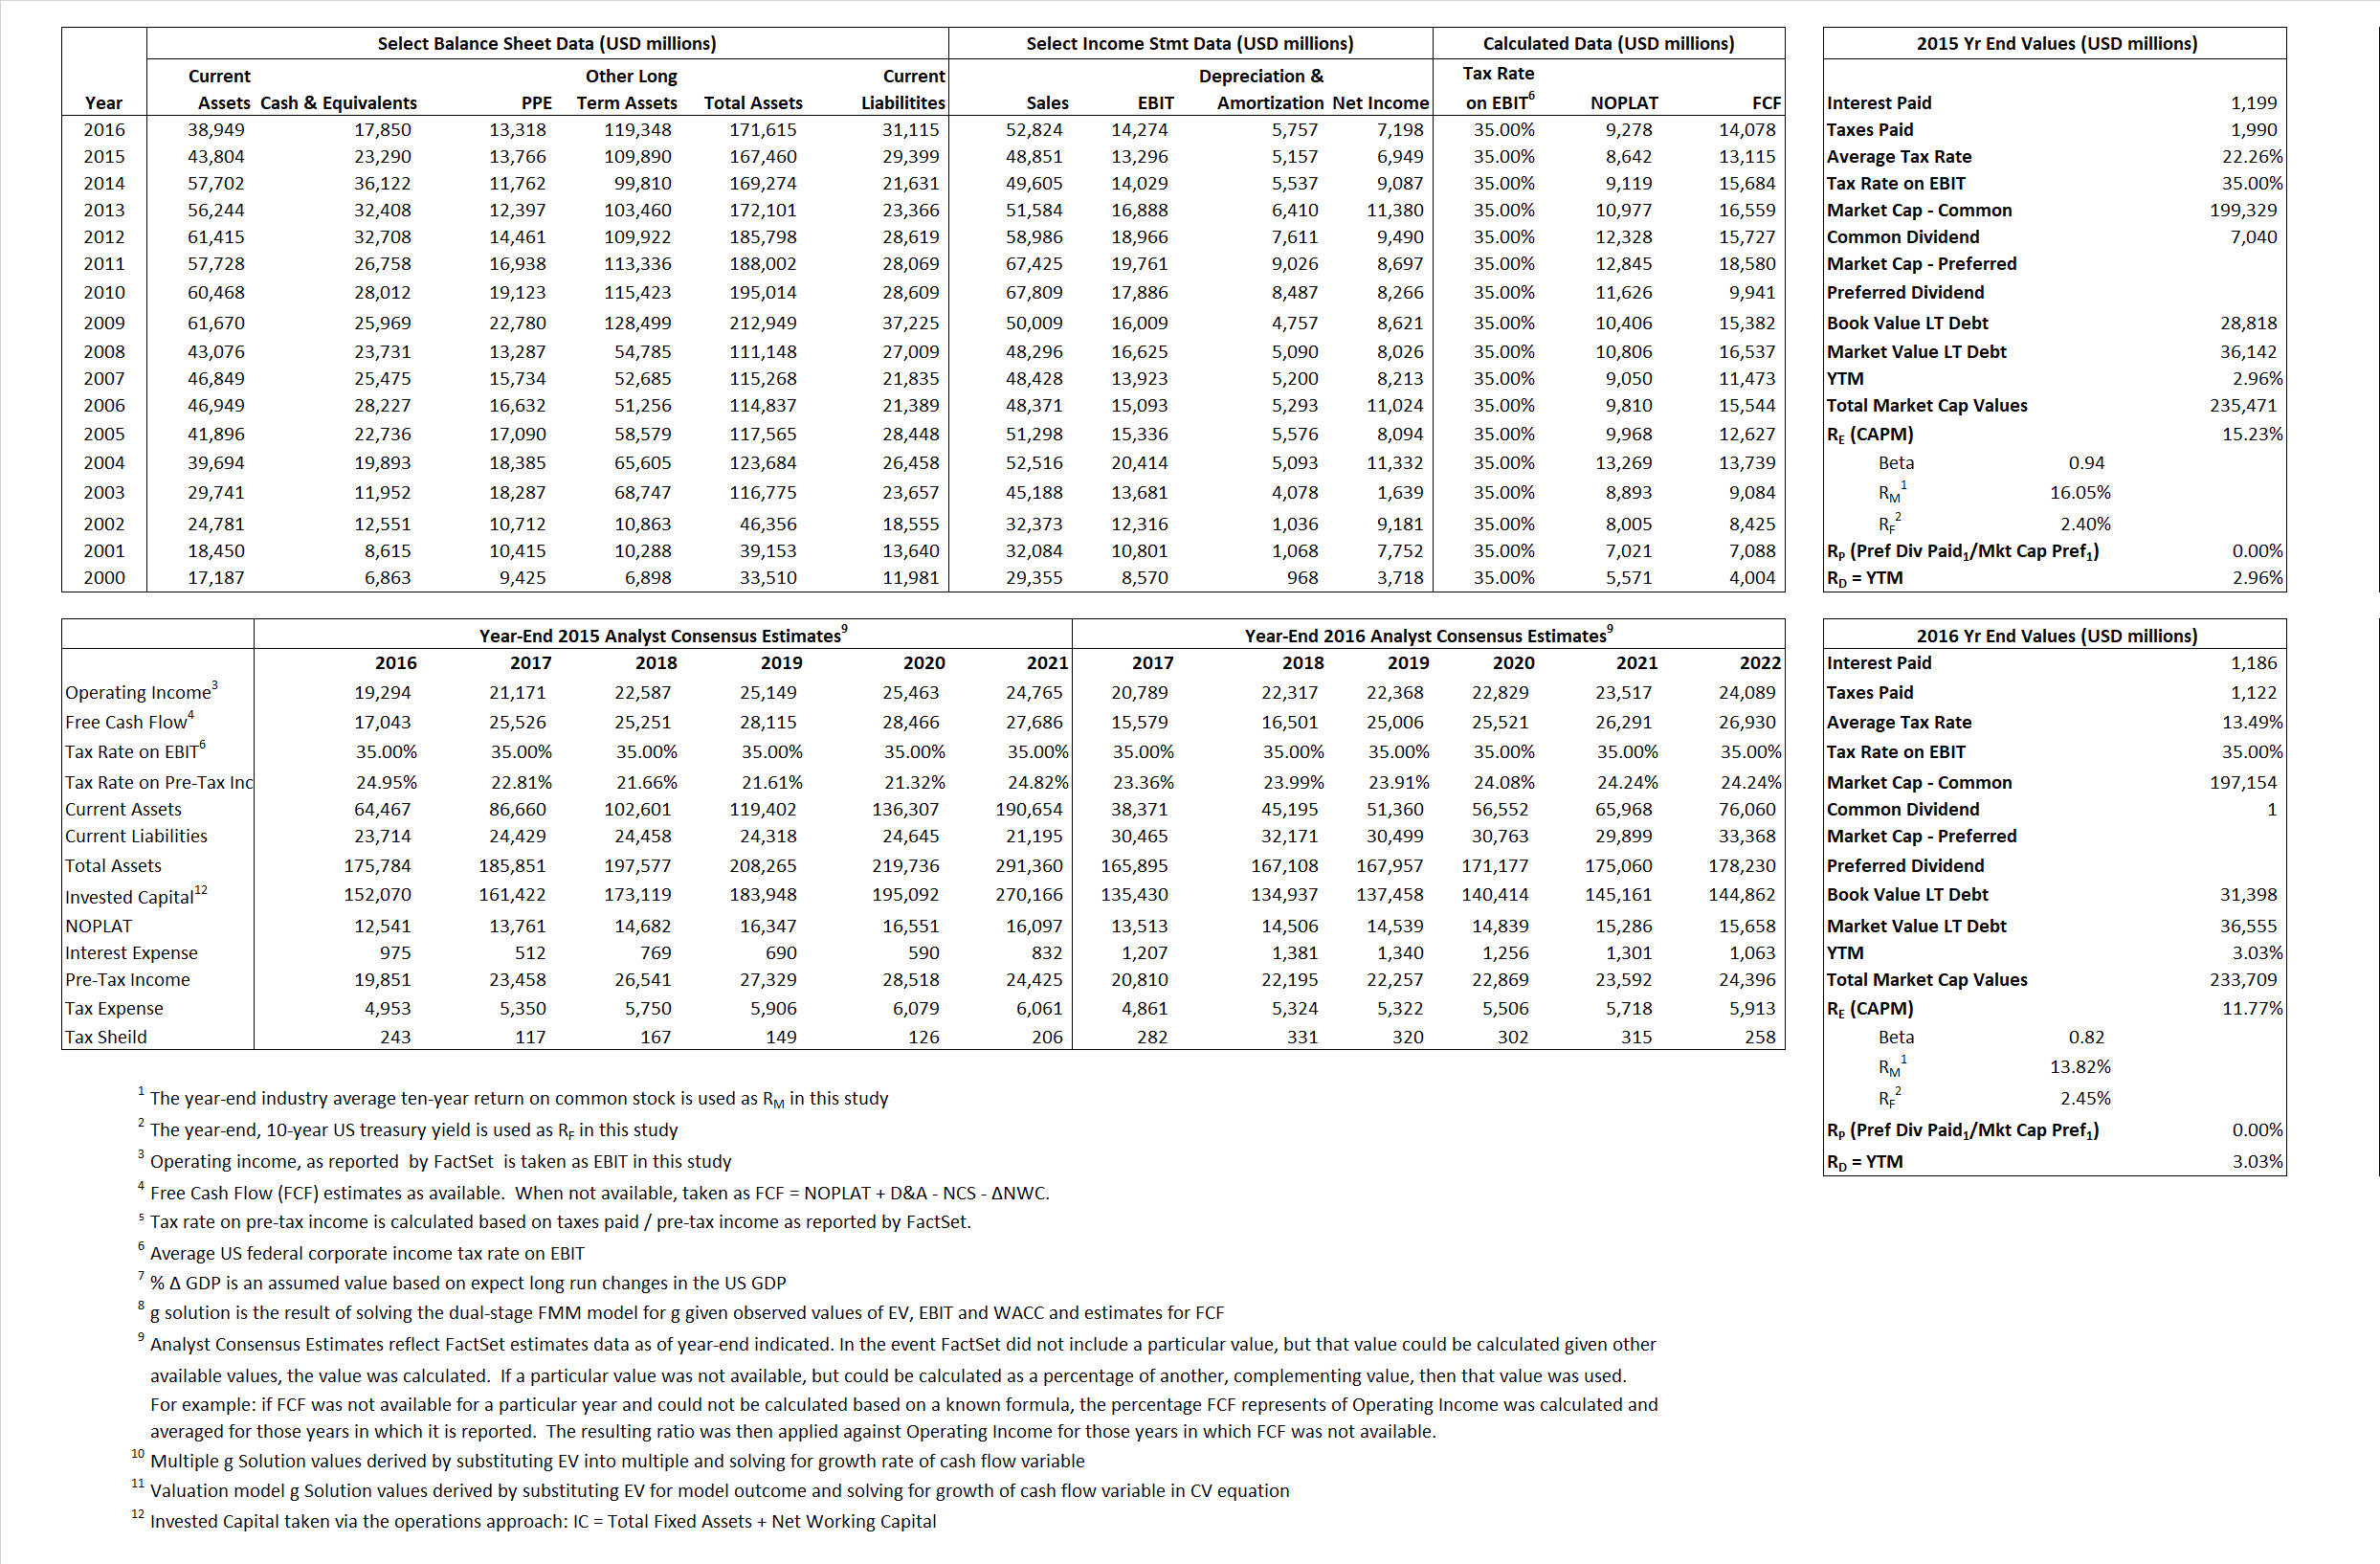
Primary Input Data
Derived Input Data
Derived Input |
Label |
2015 Value |
2016
|
Equational Form |
| Net Operating Profit Less Adjusted Taxes | NOPLAT | 8,642 | 9,278 |  |
| Free Cash Flow | FCF | 13,115 | 14,078 |  |
| Tax Shield | TS | 267 | 160 |  |
| Invested Capital | IC | 138,061 | 140,500 |  |
| Return on Invested Capital | ROIC | 6.26% | 6.60% |  |
| Net Investment | NetInv | (4,425) | 8,196 |  |
| Investment Rate | IR | -51.20% | 88.34% |  |
| Weighted Average Cost of Capital |
WACCMarket | 13.25% | 10.34% |  |
| WACCBook | 7.79% | 6.80% | ||
| Enterprise value |
EVMarket | 212,181 | 215,859 |  |
| EVBook | 210,297 | 210,702 | ||
| Long-Run Growth |
g = IR x ROIC |
-3.21% | 5.83% | Long-run growth rates of the income variable are used in the Continuing Value portion of the valuation models. |
g = %  GDP GDP |
2.50% | 2.50% | ||
| Margin from Operations | M | 27.22% | 27.02% |  |
| Depreciation/Amortization Rate | D | 27.95% | 28.74% |  |
Valuation Multiple Outcomes
The outcomes presented in this study are the result of original input data, derived data, and synthesized inputs.
Equational Form |
Observed Value |
Single-stagemultiple g solution |
Two-stage valuationmodel g solution |
|||
| 12/31/2015 | 12/31/2016 | 12/31/2015 | 12/31/2016 | 12/31/2015 | 12/31/2016 | |
|
|
4.34 | 4.09 | 26.26% | 17.31% | 22.95% | 12.81% |
|
|
11.50 | 10.78 | 26.26% | 17.31% | 22.95% | 12.81% |
|
|
24.55 | 23.27 | 26.26% | 17.31% | 22.95% | 12.81% |
|
|
16.18 | 15.33 | 26.26% | 17.31% | 22.95% | 12.81% |
|
|
15.96 | 15.12 | 26.26% | 17.31% | 22.95% | 12.81% |
|
|
1.54 | 1.54 | 26.26% | 17.31% | 22.95% | 12.81% |


