NORFOLK
Analyst Listing
The following analysts provide coverage for the subject firm as of May 2016:
| Broker | Analyst | Analyst Email |
| Credit Suisse | Allison M. Landry | allison.landry@credit-suisse.com |
| Susquehanna Financial Group | Bascome Majors | bascome.majors@sig.com |
| TD Securities | Cherilyn Radbourne | cherilyn.radbourne@tdsecurities.com |
| Bernstein Research | David Vernon | david.vernon@bernstein.com |
| Avondale Partners | Donald Broughton | dbroughton@avondalepartnersllc.com |
| BMO Capital Markets | Fadi Chamoun | fadi.chamoun@bmo.com |
| Cowen & Company | Jason H. Seidl | jason.seidl@cowen.com |
| Buckingham Research | Jeffrey Kauffman | jkauffman@buckresearch.com |
| RBC Capital Markets | John Barnes | john.barnes@rbccm.com |
| Stifel Nicolaus | John G. Larkin | jglarkin@stifel.com |
| Stephens Inc | Justin Long | justin.long@stephens.com |
| BB&T Capital Markets | Mark A. Levin | mlevin@bbandtcm.com |
| Nomura Research | Matt Troy | matt.troy@nomura.com |
| Raymond James | Patrick Tyler Brown | tyler.brown@raymondjames.com |
| Topeka Capital Markets | Rick Paterson | rp@topekacapitalmarkets.com |
| Deutsche Bank Research | Robert Salmon | robert.salmon@db.com |
| Wolfe Research | Scott H. Group | sgroup@wolferesearch.com |
| Scotiabank GBM | Turan Quettawala | turan.quettawala@scotiabank.com |
Primary Input Data
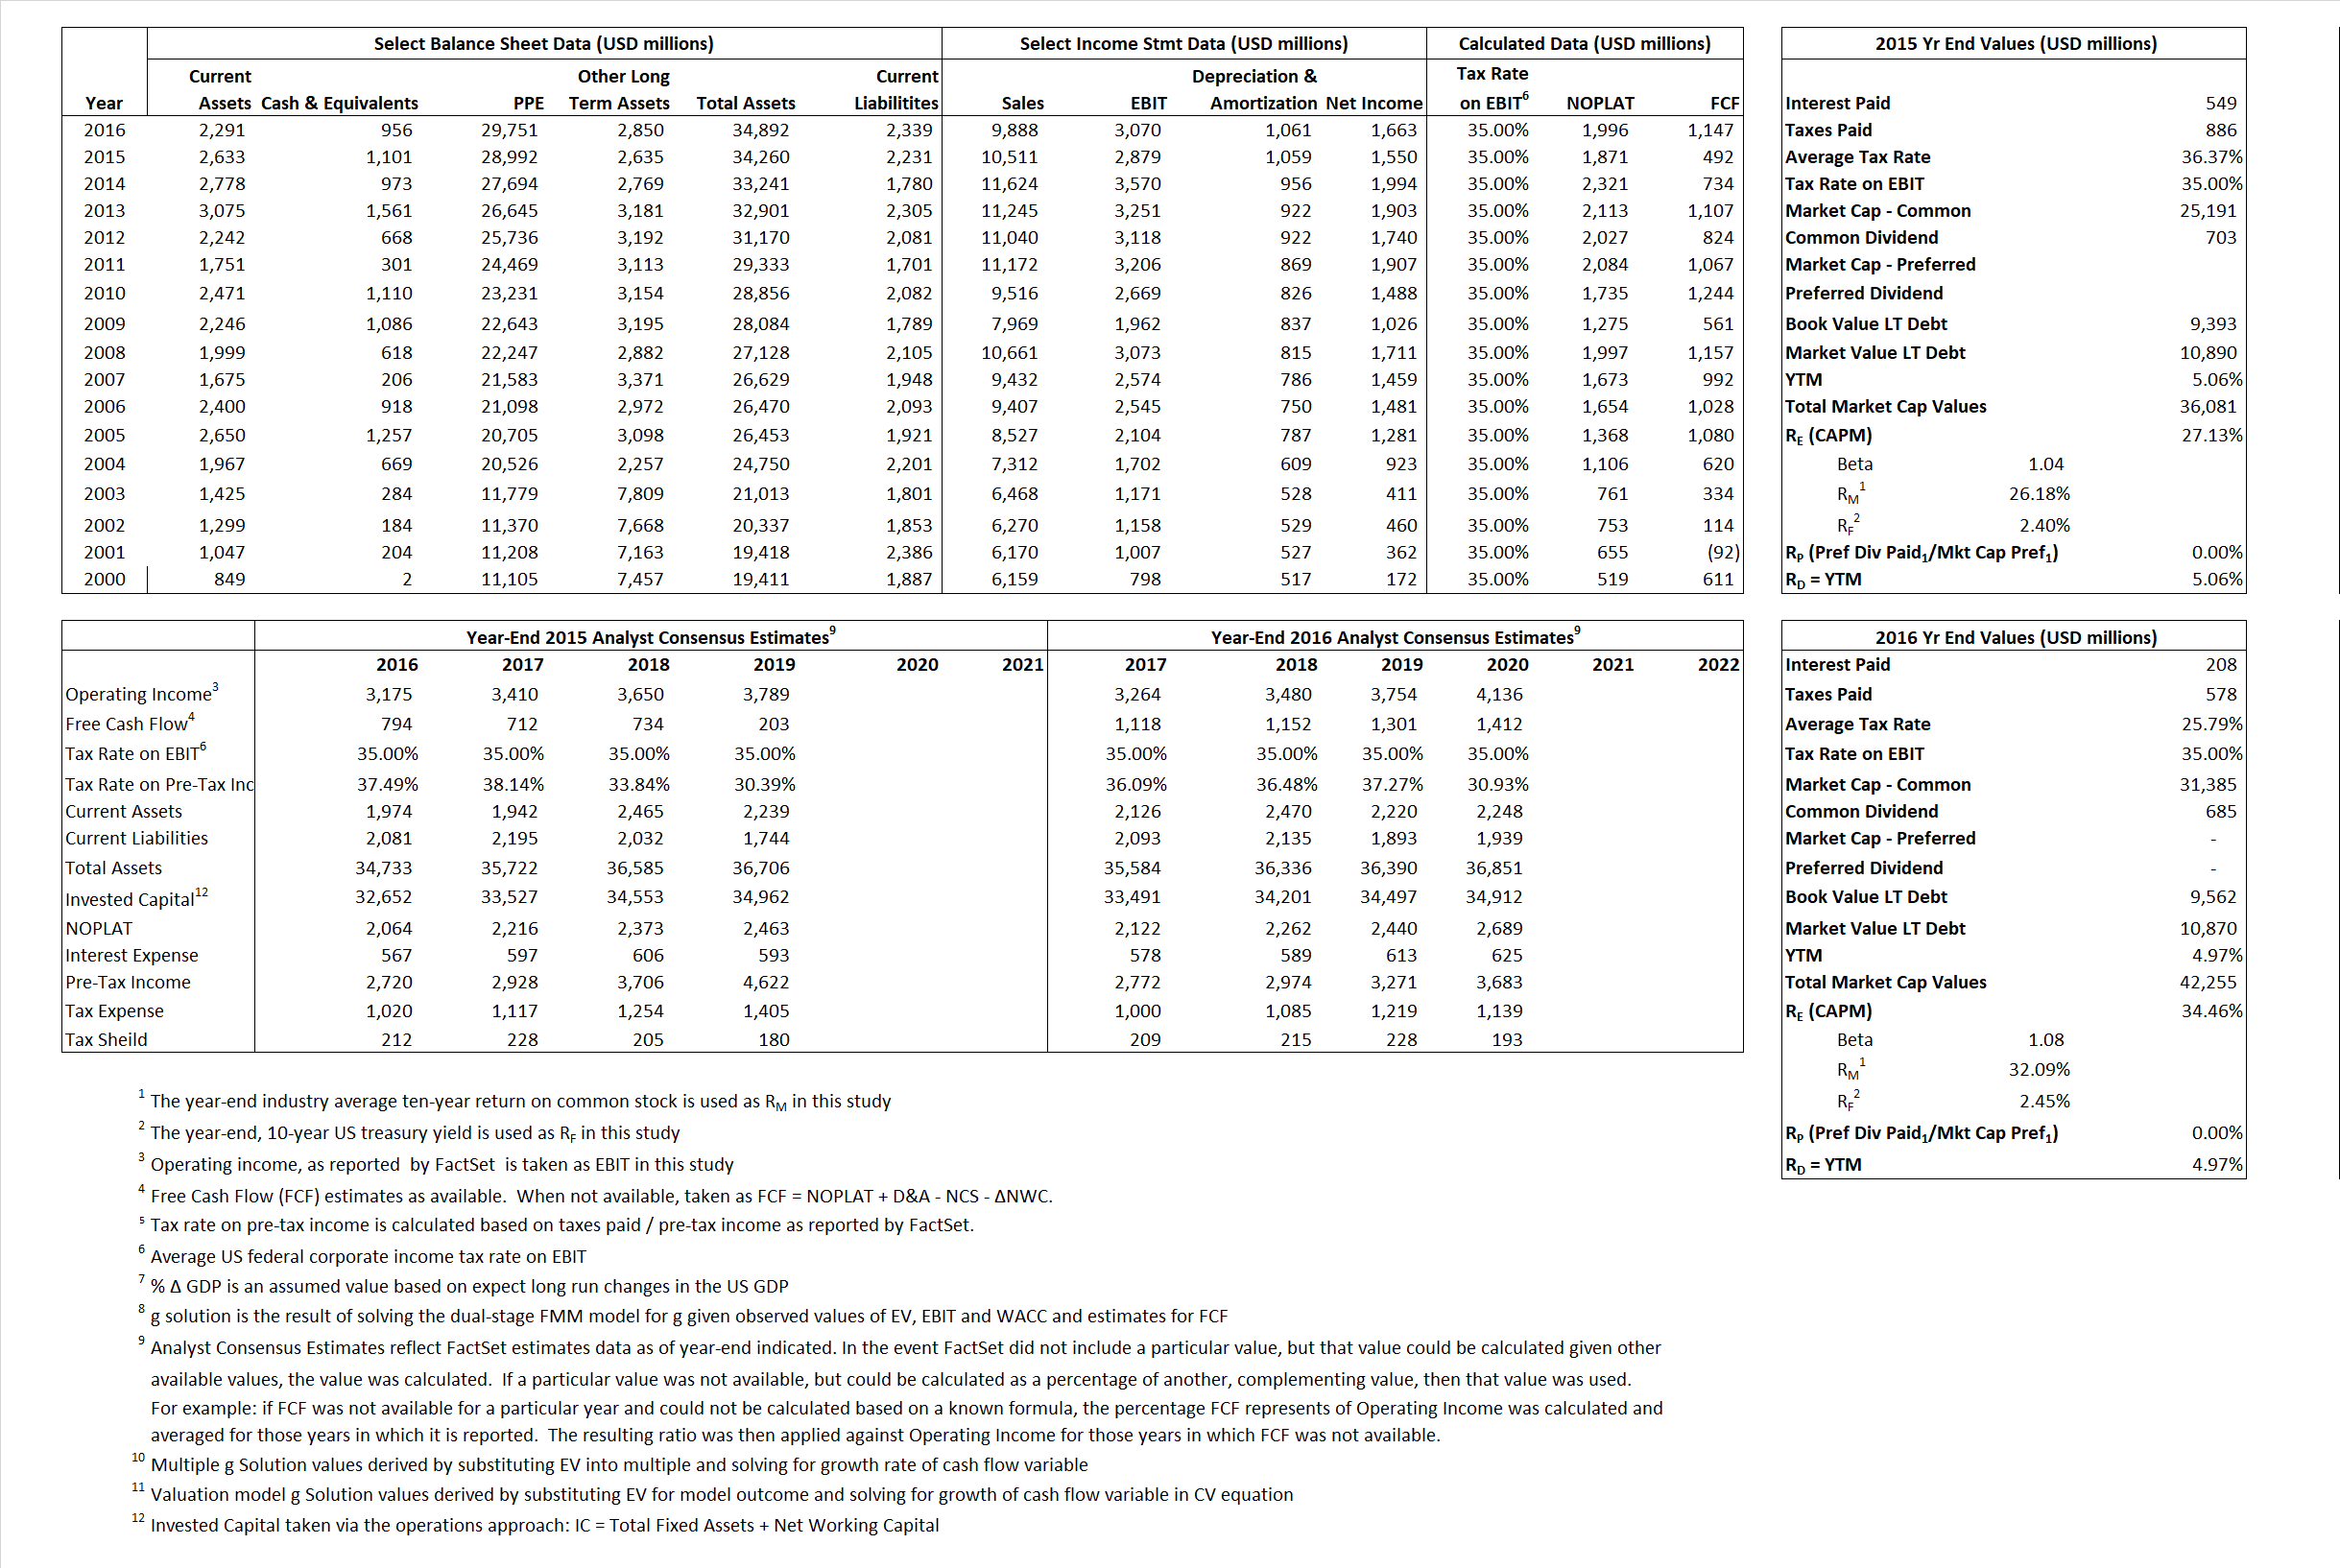
Derived Input Data
Derived Input |
Label |
2015 Value |
2016
|
Equational Form |
| Net Operating Profit Less Adjusted Taxes | NOPLAT | 1,871 | 1,996 |  |
| Free Cash Flow | FCF | 492 | 1,147 |  |
| Tax Shield | TS | 200 | 54 |  |
| Invested Capital | IC | 32,029 | 32,553 |  |
| Return on Invested Capital | ROIC | 5.84% | 6.13% |  |
| Net Investment | NetInv | 1,627 | 1,585 |  |
| Investment Rate | IR | 86.94% | 79.43% |  |
| Weighted Average Cost of Capital |
WACCMarket | 19.91% | 26.54% |  |
| WACCBook | 7.45% | 7.66% | ||
| Enterprise value |
EVMarket | 34,980 | 41,299 |  |
| EVBook | 33,628 | 39,991 | ||
| Long-Run Growth |
g = IR x ROIC |
5.08% | 4.87% | Long-run growth rates of the income variable are used in the Continuing Value portion of the valuation models. |
g = %  GDP GDP |
2.50% | 2.50% | ||
| Margin from Operations | M | 27.39% | 31.05% |  |
| Depreciation/Amortization Rate | D | 26.89% | 25.68% |  |
Valuation Multiple Outcomes
The outcomes presented in this study are the result of original input data, derived data, and synthesized inputs.
Equational Form |
Observed Value |
Single-stagemultiple g solution |
Two-stage valuationmodel g solution |
|||
| 12/31/2015 | 12/31/2016 | 12/31/2015 | 12/31/2016 | 12/31/2015 | 12/31/2016 | |
|
|
3.33 | 4.18 | 172.65% | 102.53% | 32.15% | 35.60% |
|
|
8.88 | 10.00 | 172.65% | 102.53% | 32.15% | 35.60% |
|
|
18.69 | 20.70 | 172.65% | 102.53% | 32.15% | 35.60% |
|
|
71.10 | 36.01 | 172.65% | 102.53% | 32.15% | 35.60% |
|
|
12.15 | 13.45 | 172.65% | 102.53% | 32.15% | 35.60% |
|
|
1.09 | 1.27 | 172.65% | 102.53% | 32.15% | 35.60% |


