PayPal Holdings
Analyst Listings
The following analysts provide coverage for the subject firm as of May 2016:
Primary Input Data
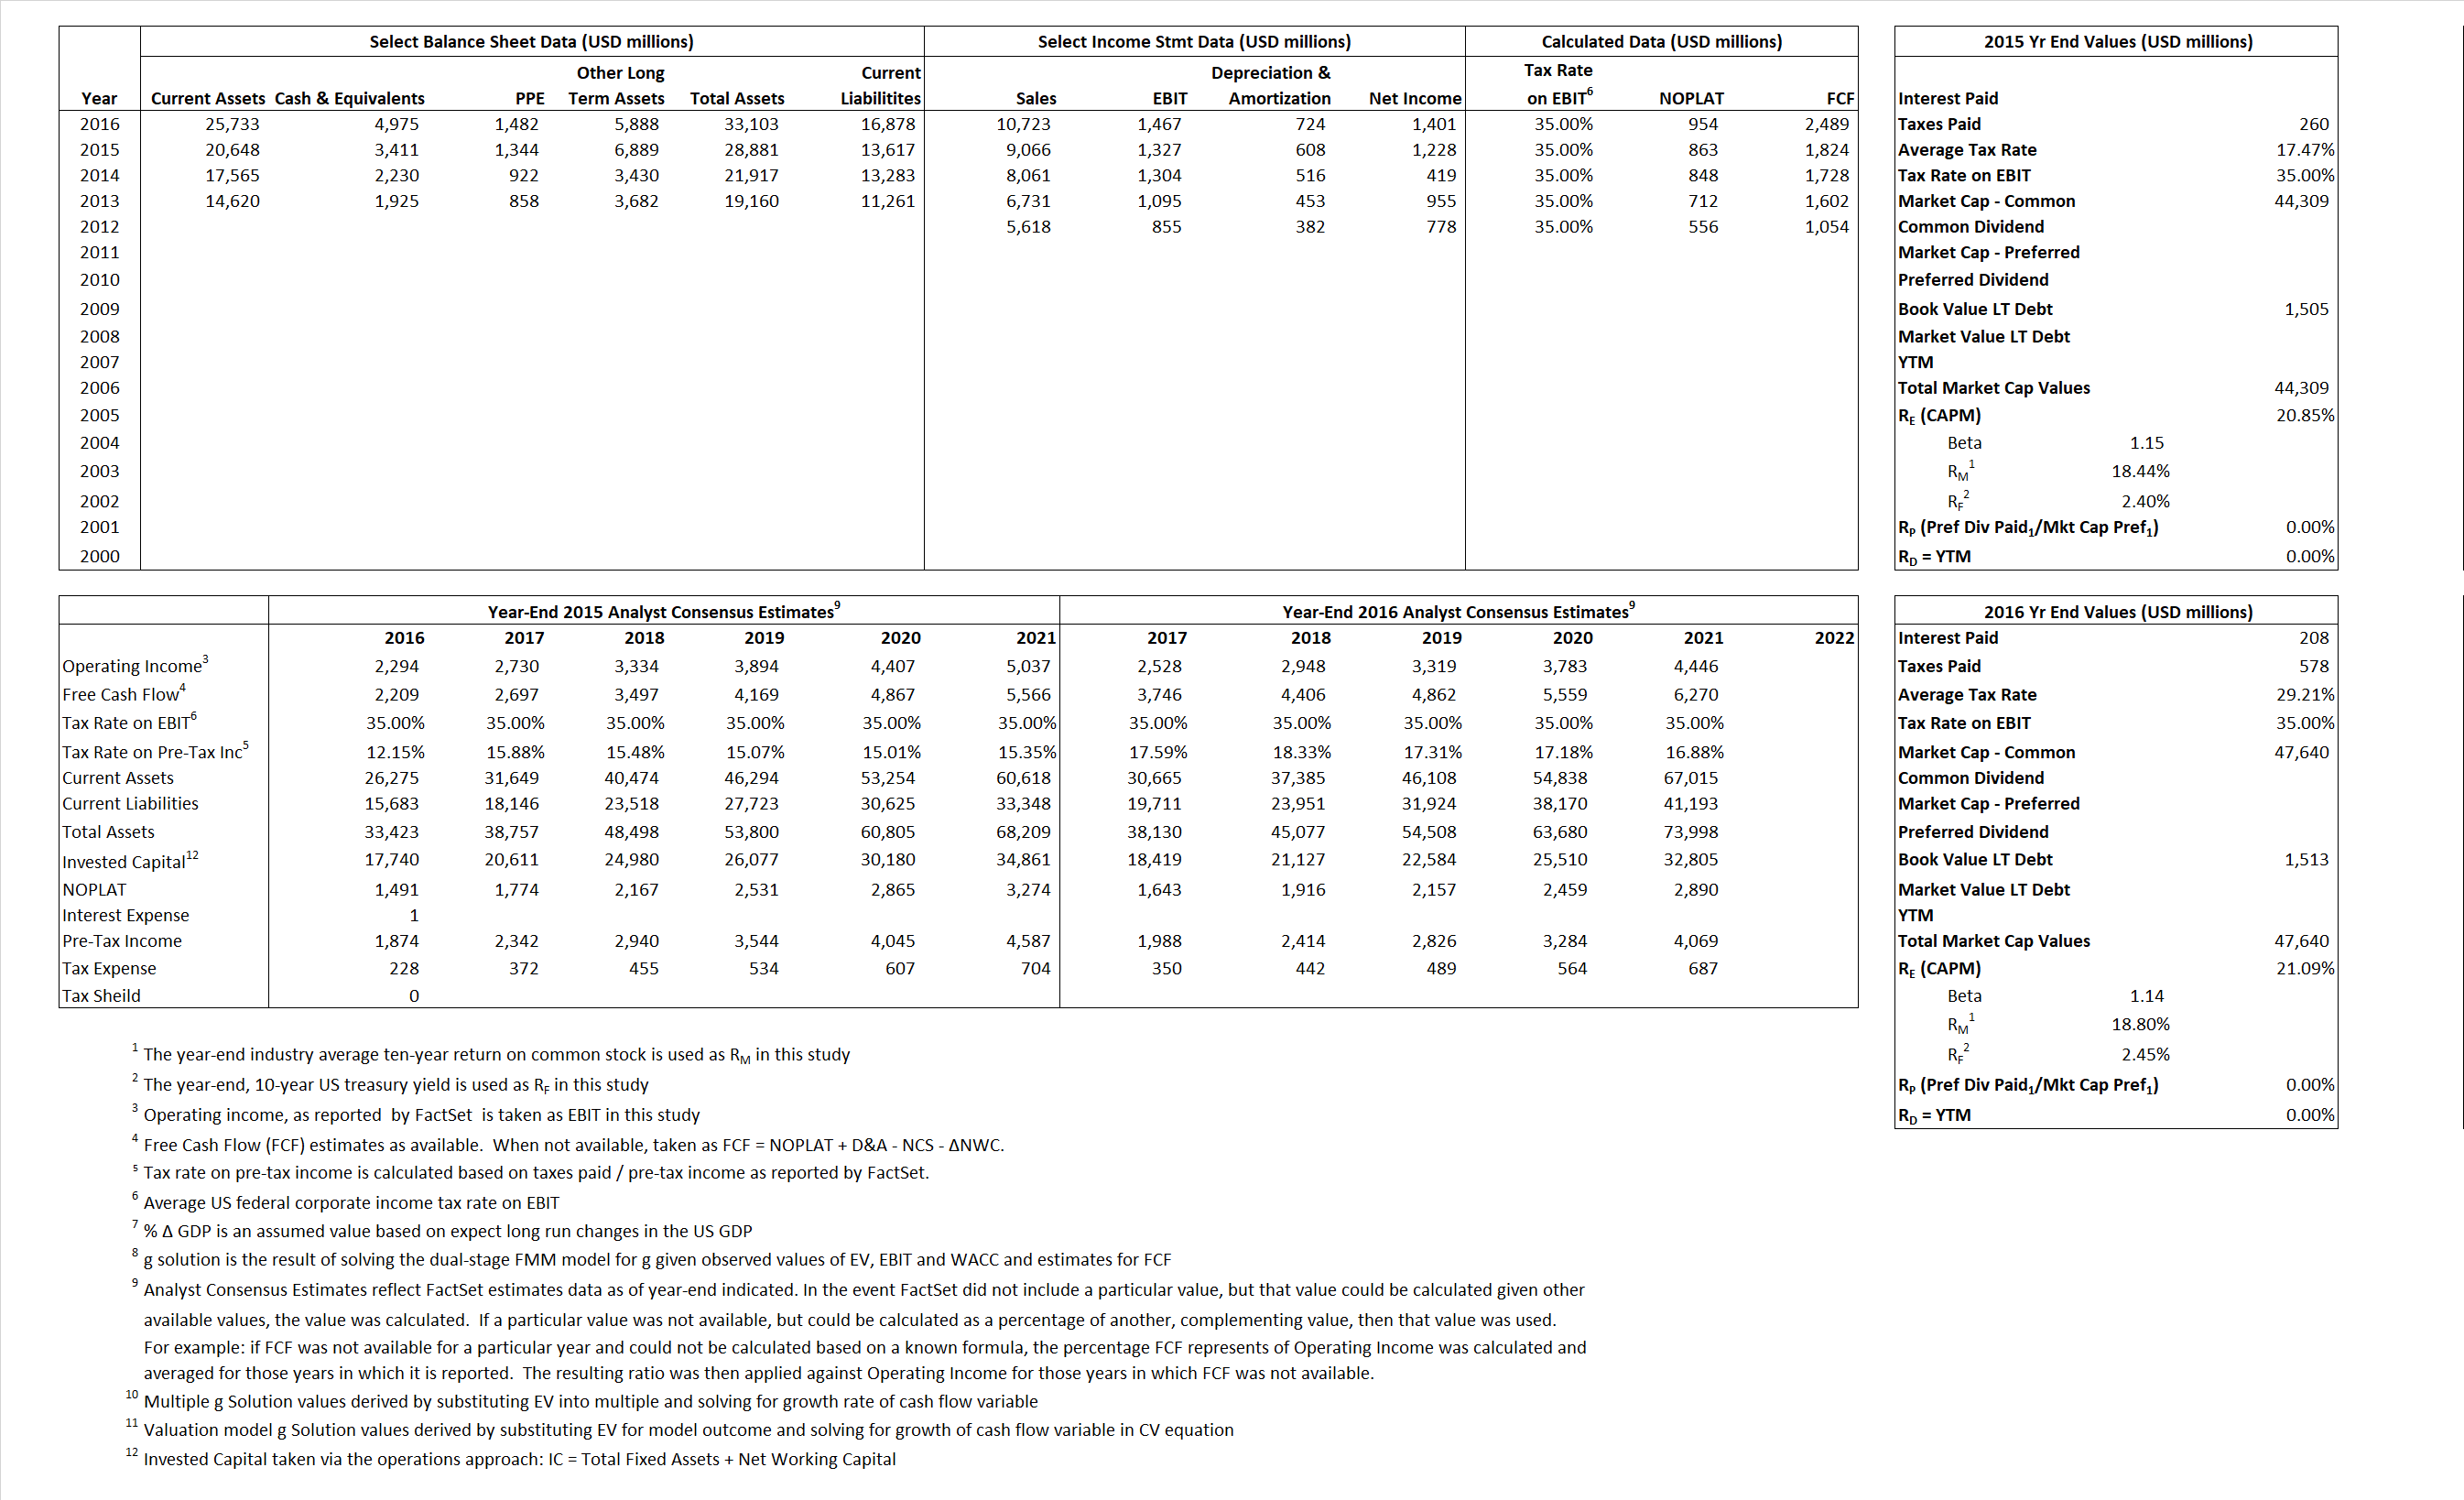
Derived Input Data
Derived Input |
Label |
2015 Value |
2016
|
Equational Form |
| Net Operating Profit Less Adjusted Taxes | NOPLAT | 863 | 954 |  |
| Free Cash Flow | FCF | 1,824 | 2,489 |  |
| Tax Shield | TS | – | 61 |  |
| Invested Capital | IC | 15,264 | 16,225 |  |
| Return on Invested Capital | ROIC | 5.65% | 5.88% |  |
| Net Investment | NetInv | 7,238 | 1,685 |  |
| Investment Rate | IR | 839.14% | 176.71% |  |
| Weighted Average Cost of Capital |
WACCMarket | 20.85% | 21.09% |  |
| WACCBook | 10.46% | 9.91% | ||
| Enterprise value |
EVMarket | 40,898 | 42,665 |  |
| EVBook | 40,839 | 44,178 | ||
| Long-Run Growth |
g = IR x ROIC |
47.42% | 10.39% | Long-run growth rates of the income variable are used in the Continuing Value portion of the valuation models. |
g = %  GDP GDP |
2.50% | 2.50% | ||
| Margin from Operations | M | 14.64% | 13.68% |  |
| Depreciation/Amortization Rate | D | 31.42% | 33.04% |  |
Valuation Multiple Outcomes
The outcomes presented in this study are the result of original input data, derived data, and synthesized inputs.
Equational Form |
Observed Value |
Single-stagemultiple g solution |
Two-stage valuationmodel g solution |
|||
| 12/31/2015 | 12/31/2016 | 12/31/2015 | 12/31/2016 | 12/31/2015 | 12/31/2016 | |
|
|
4.51 | 3.98 | 29.89% | 30.42% | 24.38% | 23.69% |
|
|
21.14 | 19.47 | 29.89% | 30.42% | 24.38% | 23.69% |
|
|
47.41 | 44.74 | 29.89% | 30.42% | 24.38% | 23.69% |
|
|
2.42 | 17.14 | 29.89% | 30.42% | 24.38% | 23.69% |
|
|
30.82 | 29.08 | 29.89% | 30.42% | 24.38% | 23.69% |
|
|
2.68 | 2.63 | 29.89% | 30.42% | 24.38% | 23.69% |


