Du Pont
Analyst Listing
The following analysts provide coverage for the subject firm as of May 2016:
| Broker | Analyst | Analyst Email |
| Cowen & Company | Colby Synesael | colby.synesael@cowen.com |
| Burke and Quick Partners, LLC | Frederick W. Moran | fmoran@bqpartners.com |
| RBC Capital Markets | Jonathan Atkin | jonathan.atkin@rbccm.com |
| Jefferies | Jonathan Petersen | jpetersen@jefferies.com |
| Evercore ISI | Jonathan Schildkraut | schildkraut@evercoreisi.com |
| Stifel Nicolaus | Matthew Heinz | heinzm@stifel.com |
Primary Input Data
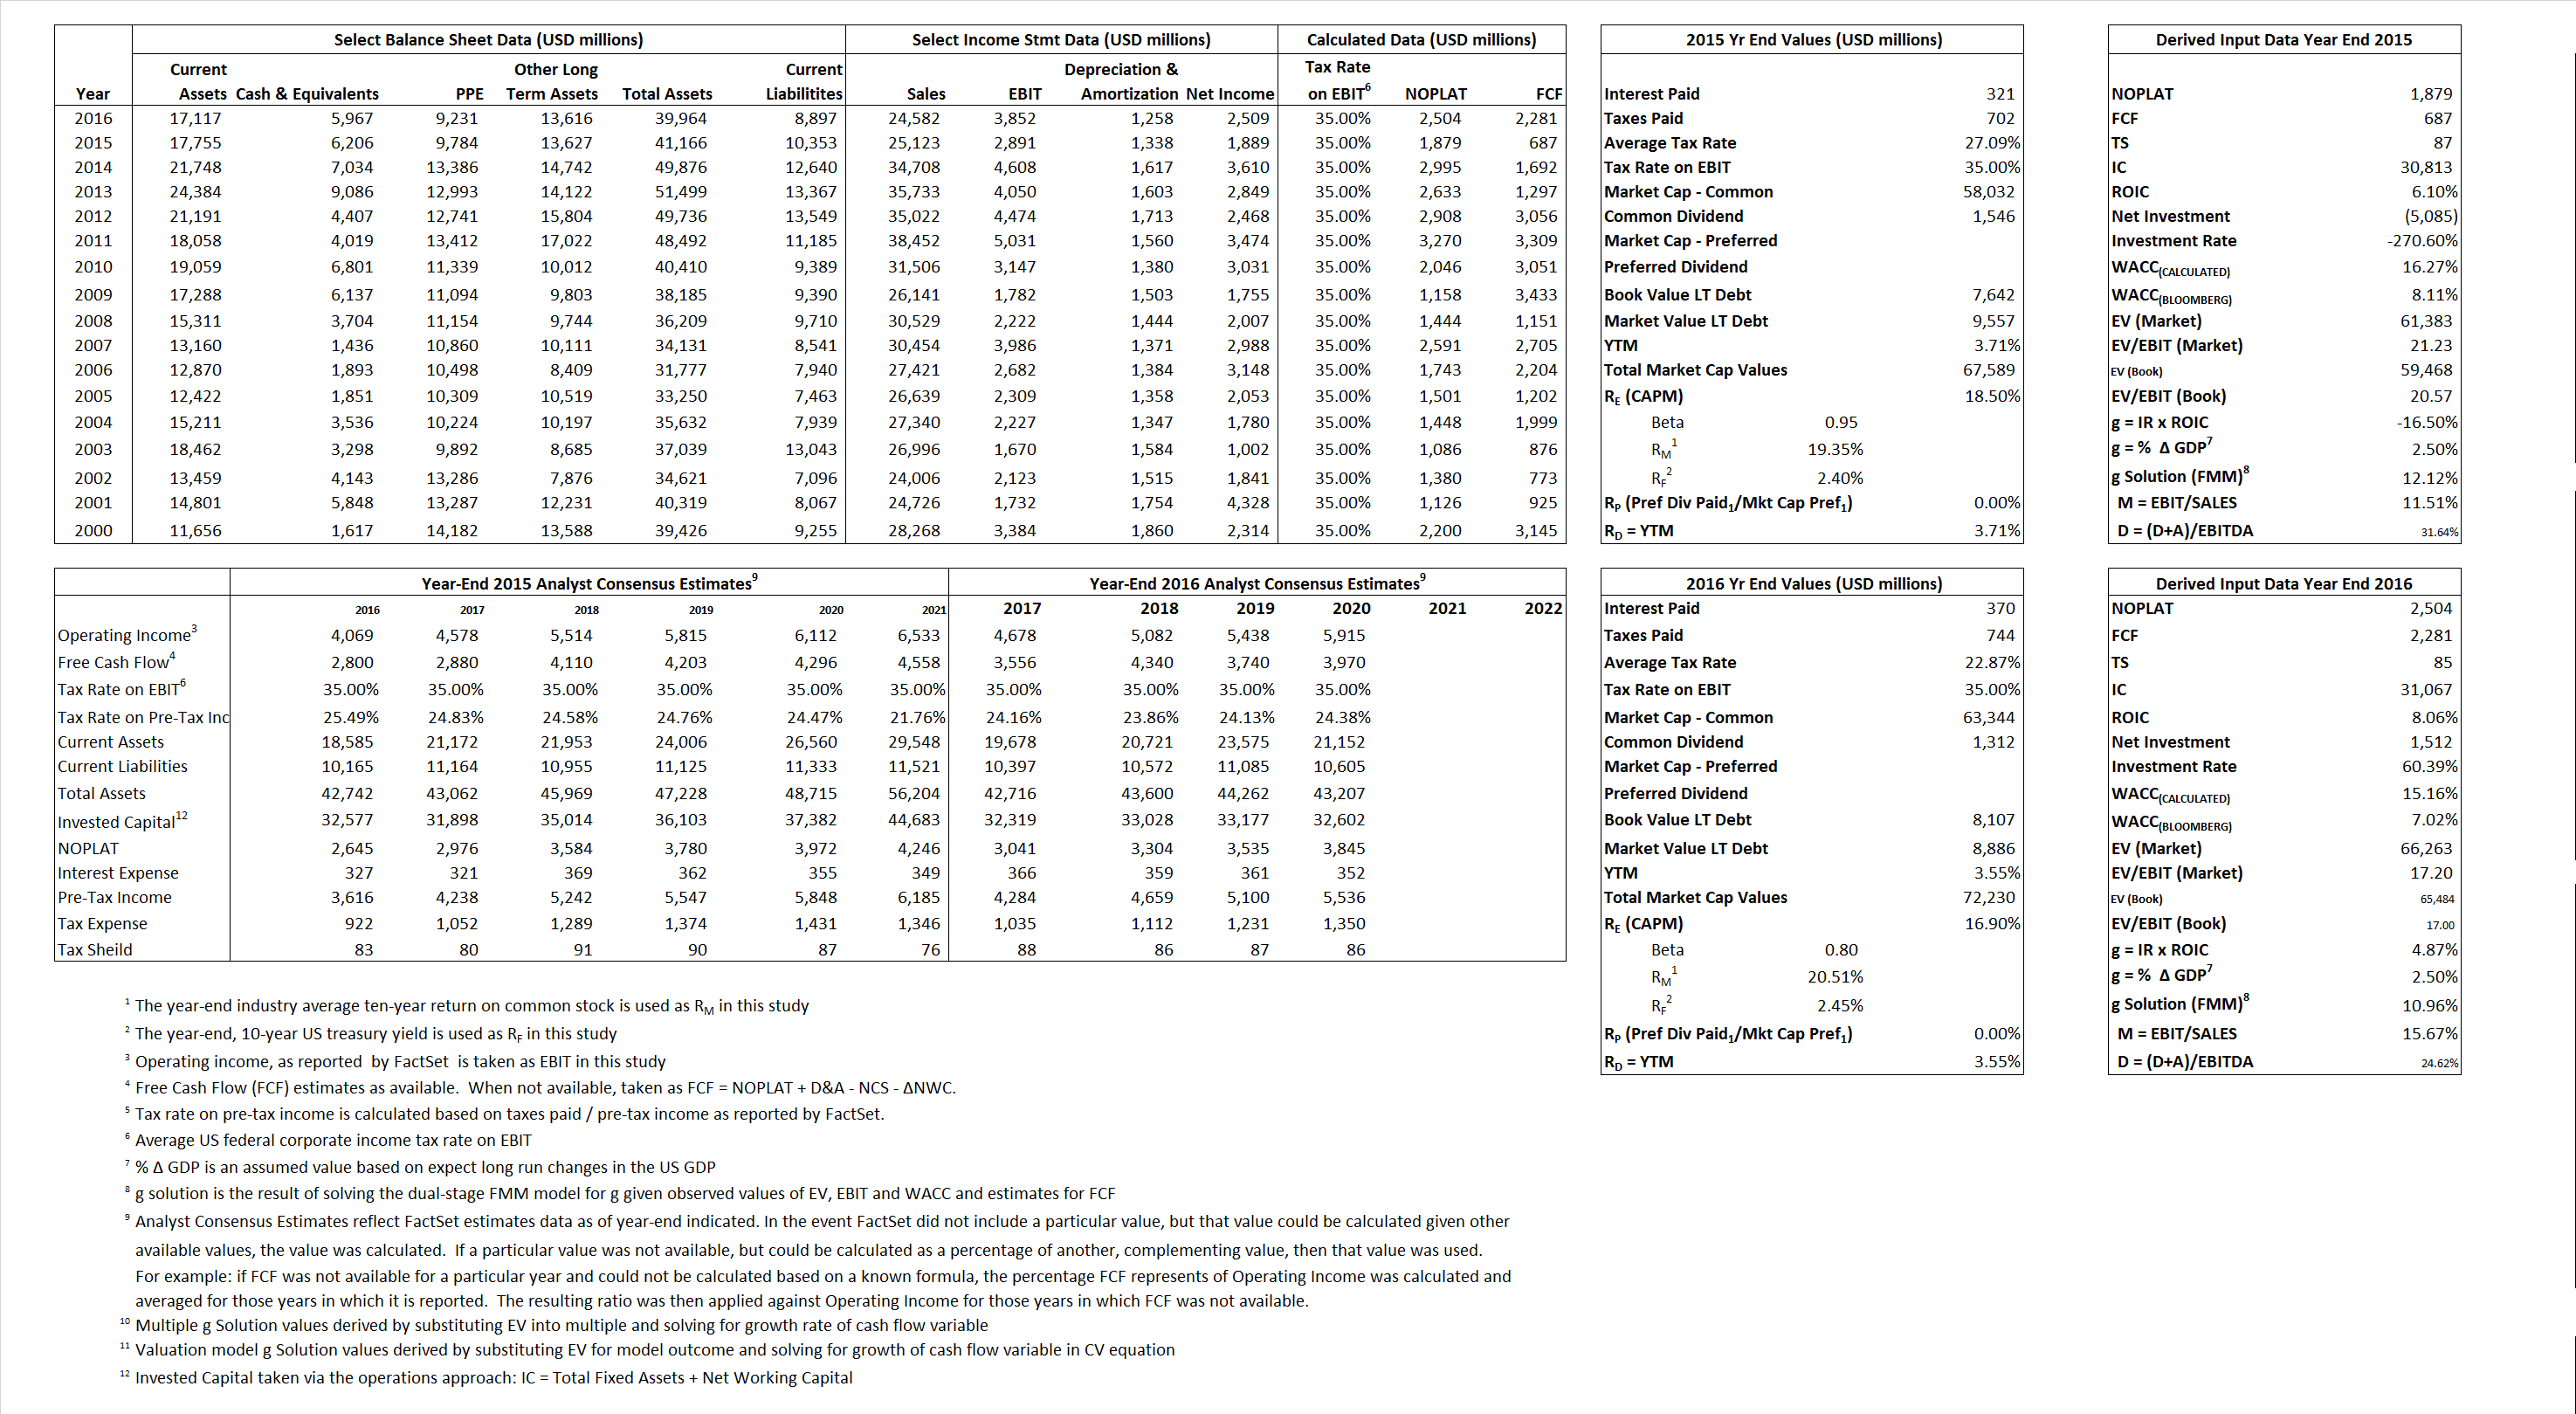
Derived Input Data
Derived Input |
Label |
2015 Value |
2016
|
Equational Form |
| Net Operating Profit Less Adjusted Taxes | NOPLAT | 1,879 | 2,504 |  |
| Free Cash Flow | FCF | 687 | 2,281 |  |
| Tax Shield | TS | 87 | 85 |  |
| Invested Capital | IC | 30,813 | 31,067 |  |
| Return on Invested Capital | ROIC | 6.10% | 8.06% |  |
| Net Investment | NetInv | (5,085) | 1,512 |  |
| Investment Rate | IR | -270.60% | 60.39% |  |
| Weighted Average Cost of Capital |
WACCMarket | 16.27% | 15.16% |  |
| WACCBook | 8.11% | 7.02% | ||
| Enterprise value |
EVMarket | 61,383 | 66,263 |  |
| EVBook | 59,468 | 65,484 | ||
| Long-Run Growth |
g = IR x ROIC |
-16.50% | 4.87% | Long-run growth rates of the income variable are used in the Continuing Value portion of the valuation models. |
g = %  GDP GDP |
2.50% | 2.50% | ||
| Margin from Operations | M | 11.51% | 15.67% |  |
| Depreciation/Amortization Rate | D | 31.64% | 24.62% |  |
Valuation Multiple Outcomes
The outcomes presented in this study are the result of original input data, derived data, and synthesized inputs.
Equational Form |
Observed Value |
Single-stagemultiple g solution |
Two-stage valuationmodel g solution |
|||
| 12/31/2015 | 12/31/2016 | 12/31/2015 | 12/31/2016 | 12/31/2015 | 12/31/2016 | |
|
|
2.44 | 2.70 | 26.52% | 21.41% | 20.43% | 17.74% |
|
|
14.51 | 12.97 | 26.52% | 21.41% | 20.43% | 17.74% |
|
|
32.67 | 26.47 | 26.52% | 21.41% | 20.43% | 17.74% |
|
|
89.35 | 29.05 | 26.52% | 21.41% | 20.43% | 17.74% |
|
|
21.23 | 17.20 | 26.52% | 21.41% | 20.43% | 17.74% |
|
|
1.99 | 2.13 | 26.52% | 21.41% | 20.43% | 17.74% |


