Lockheed Martin Corp.
Analyst Listing
The following analysts provide coverage for the subject firm as of May 2016:
| Broker | Analyst | Analyst Email |
| Cowen & Company | Cai von Rumohr | cai.von-rumohr@cowen.com |
| Bernstein Research | Douglas S. Harned | douglas.harned@bernstein.com |
| Jefferies | Howard A. Rubel | hrubel@jefferies.com |
| Wolfe Research | Hunter K. Keay | hkeay@wolferesearch.com |
| Stifel Nicolaus | Joseph W. DeNardi | denardij@stifel.com |
| Deutsche Bank Research | Myles Walton | myles.walton@db.com |
| CRT Capital Group | Peter Arment | parment@sterneageecrt.com |
| Drexel Hamilton | Peter Skibitski | pskibitski@drexelhamilton.com |
| Buckingham Research | Richard Safran | rsafran@buckresearch.com |
| Credit Suisse | Robert Spingarn | robert.spingarn@credit-suisse.com |
| RBC Capital Markets | Robert Stallard | robert.stallard@rbccm.com |
| Guggenheim Securities | Roman Schweizer | roman.schweizer@guggenheimpartners.com |
| Wells Fargo Securities | Sam J. Pearlstein | sam.pearlstein@wellsfargo.com |
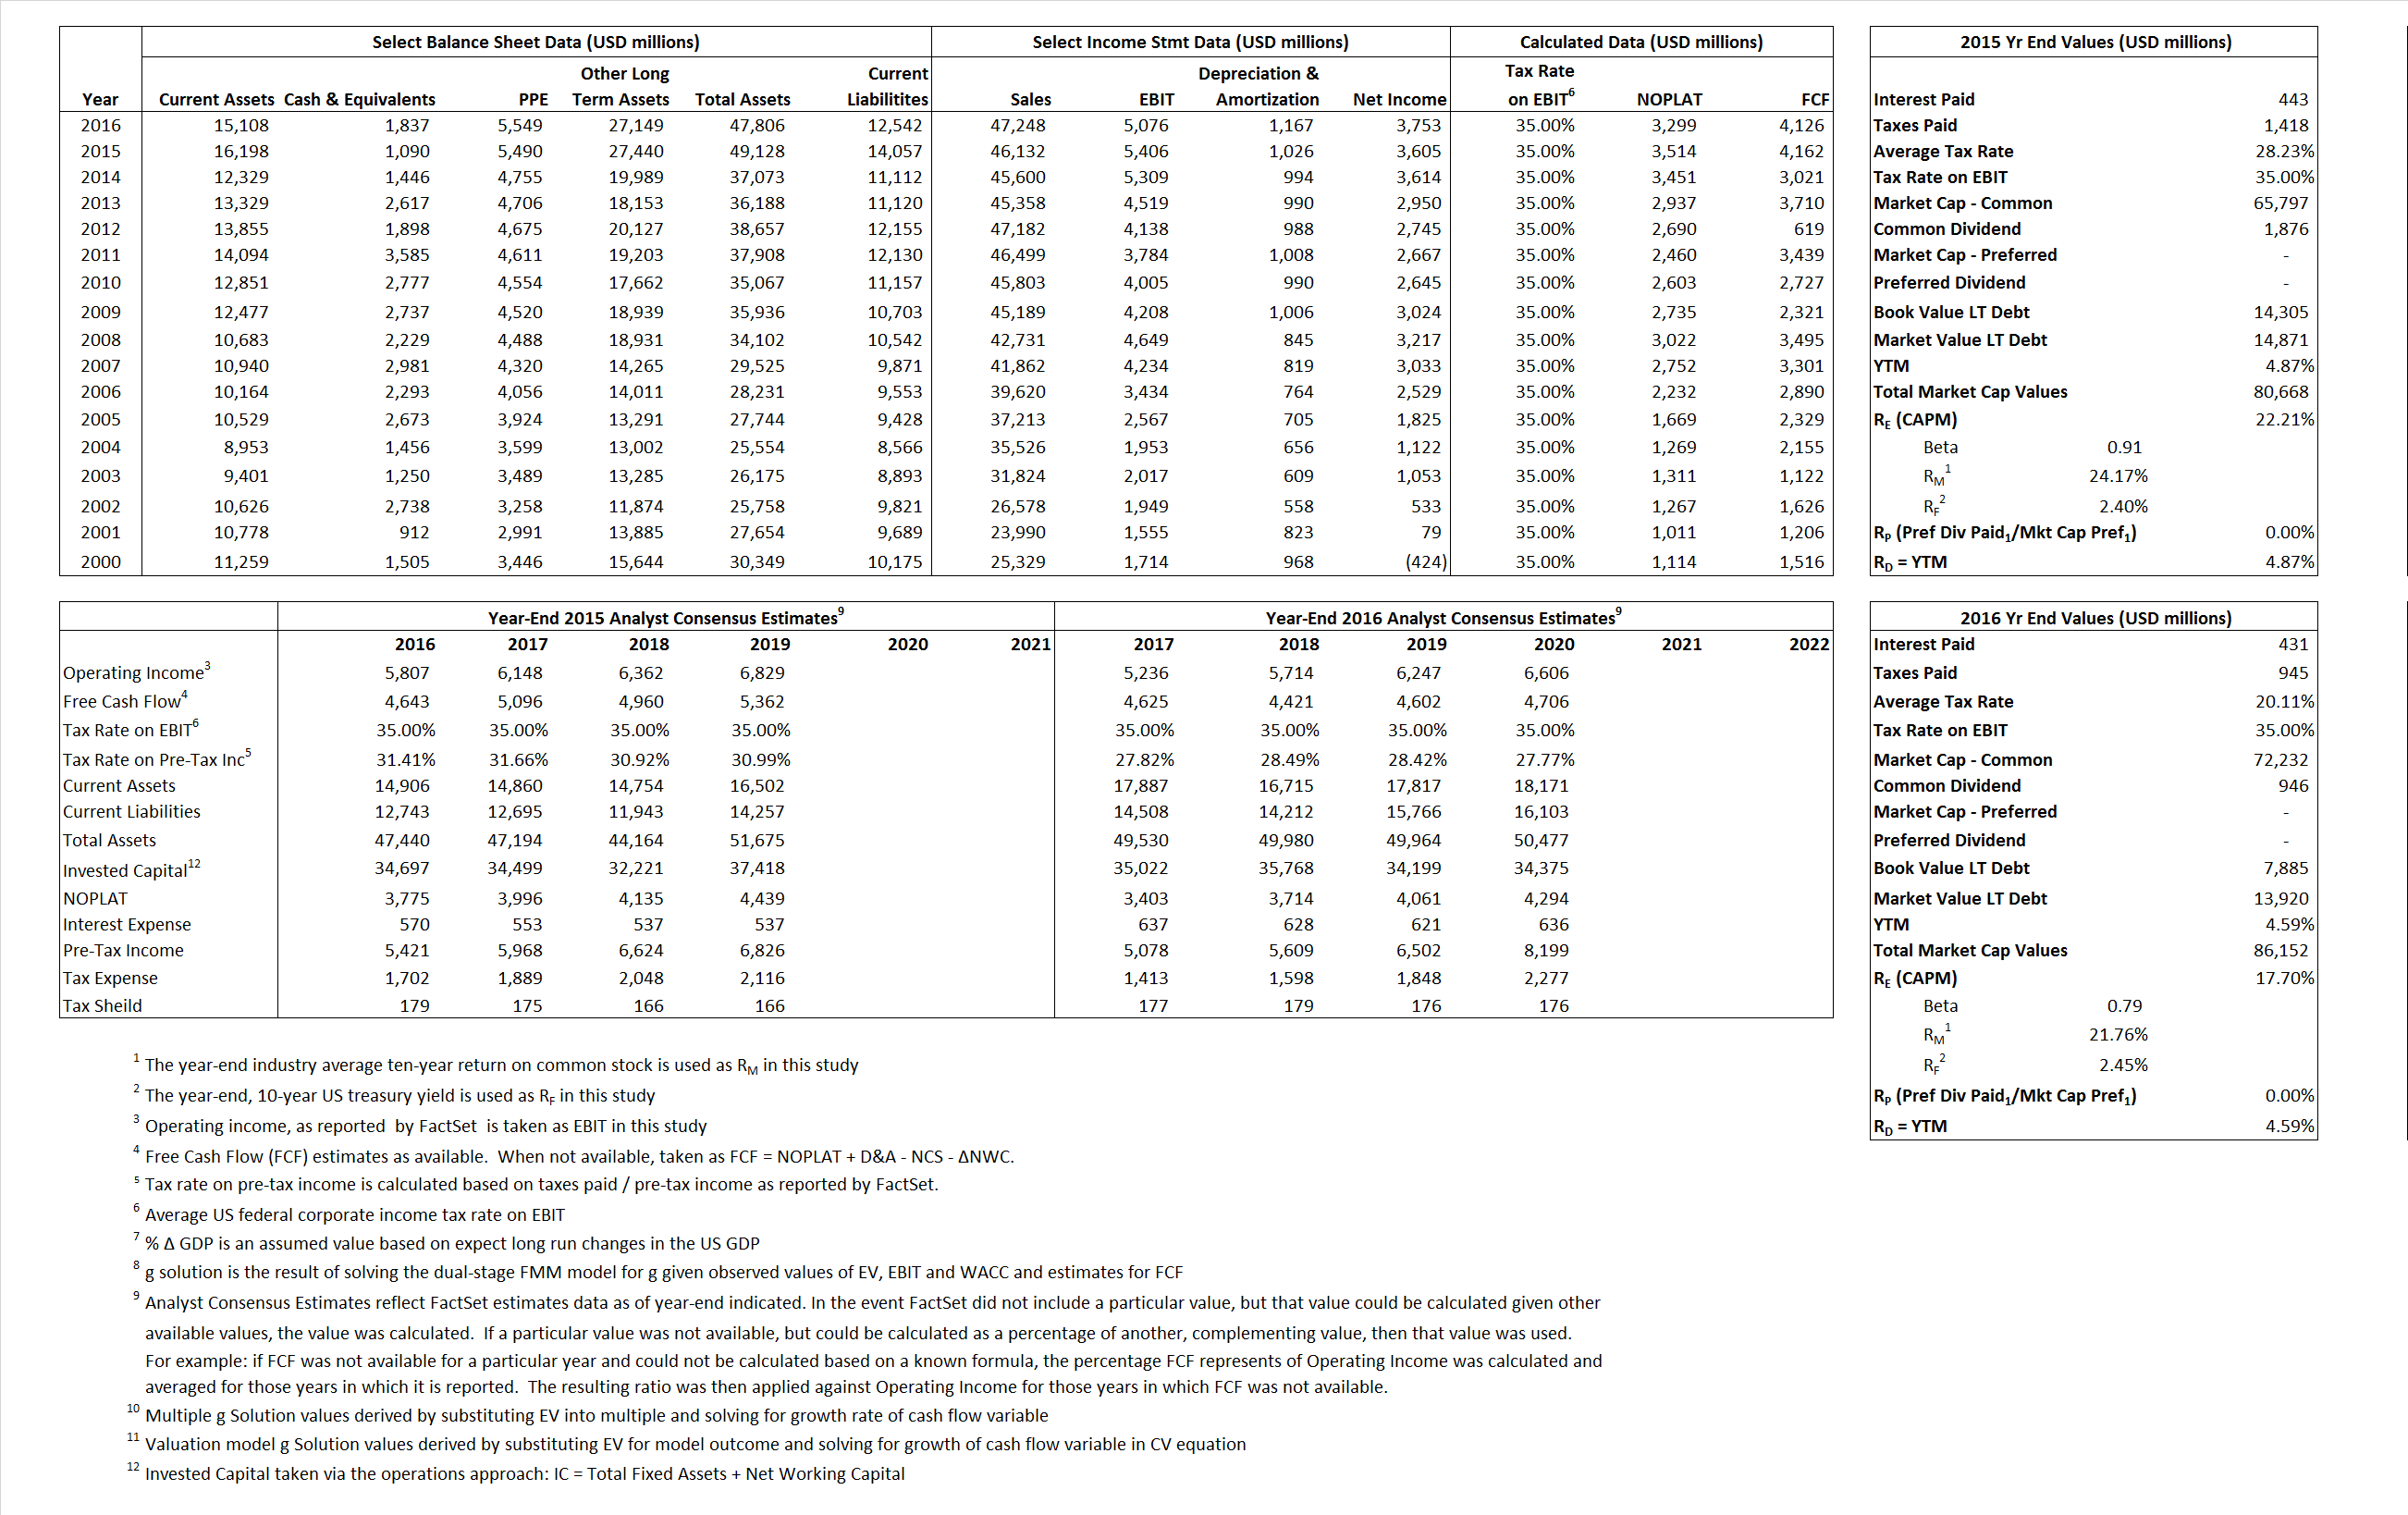
Primary Input Data
Derived Input Data
Derived Input |
Label |
2015 Value |
2016
|
Equational Form |
| Net Operating Profit Less Adjusted Taxes | NOPLAT | 3,514 | 3,299 |  |
| Free Cash Flow | FCF | 4,162 | 4,126 |  |
| Tax Shield | TS | 125 | 87 |  |
| Invested Capital | IC | 35,071 | 35,264 |  |
| Return on Invested Capital | ROIC | 10.02% | 9.36% |  |
| Net Investment | NetInv | 10,136 | 1,360 |  |
| Investment Rate | IR | 288.45% | 41.22% |  |
| Weighted Average Cost of Capital |
WACCMarket | 18.76% | 15.44% |  |
| WACCBook | 7.52% | 6.77% | ||
| Enterprise value |
EVMarket | 79,578 | 84,315 |  |
| EVBook | 78,265 | 78,280 | ||
| Long-Run Growth |
g = IR x ROIC |
28.90% | 3.86% | Long-run growth rates of the income variable are used in the Continuing Value portion of the valuation models. |
g = %  GDP GDP |
2.50% | 2.50% | ||
| Margin from Operations | M | 11.72% | 10.74% |  |
| Depreciation/Amortization Rate | D | 15.95% | 18.69% |  |
Valuation Multiple Outcomes
The outcomes presented in this study are the result of original input data, derived data, and synthesized inputs.
Equational Form |
Observed Value |
Single-stagemultiple g solution |
Two-stage valuationmodel g solution |
|||
| 12/31/2015 | 12/31/2016 | 12/31/2015 | 12/31/2016 | 12/31/2015 | 12/31/2016 | |
|
|
1.73 | 1.78 | 25.65% | 19.81% | 21.92% | 17.31% |
|
|
12.37 | 13.52 | 25.65% | 19.81% | 21.92% | 17.31% |
|
|
22.65 | 25.55 | 25.65% | 19.81% | 21.92% | 17.31% |
|
|
19.12 | 20.44 | 25.65% | 19.81% | 21.92% | 17.31% |
|
|
14.72 | 16.61 | 25.65% | 19.81% | 21.92% | 17.31% |
|
|
2.27 | 2.39 | 25.65% | 19.81% | 21.92% | 17.31% |


