Nextera
Analyst Listing
The following analysts provide coverage for the subject firm as of May 2016:
| Broker | Analyst | Analyst Email |
| Deutsche Bank Research | Jonathan Arnold | jonathan.arnold@db.com |
| Wells Fargo Securities | Neil Kalton | neil.kalton@wellsfargo.com |
| Guggenheim Securities | Shahriar Pourreza | shahriar.pourreza@guggenheimpartners.com |
| Mizuho Securities USA | James Von Riesemann | james.vonriesemann@us.mizuho-sc.com |
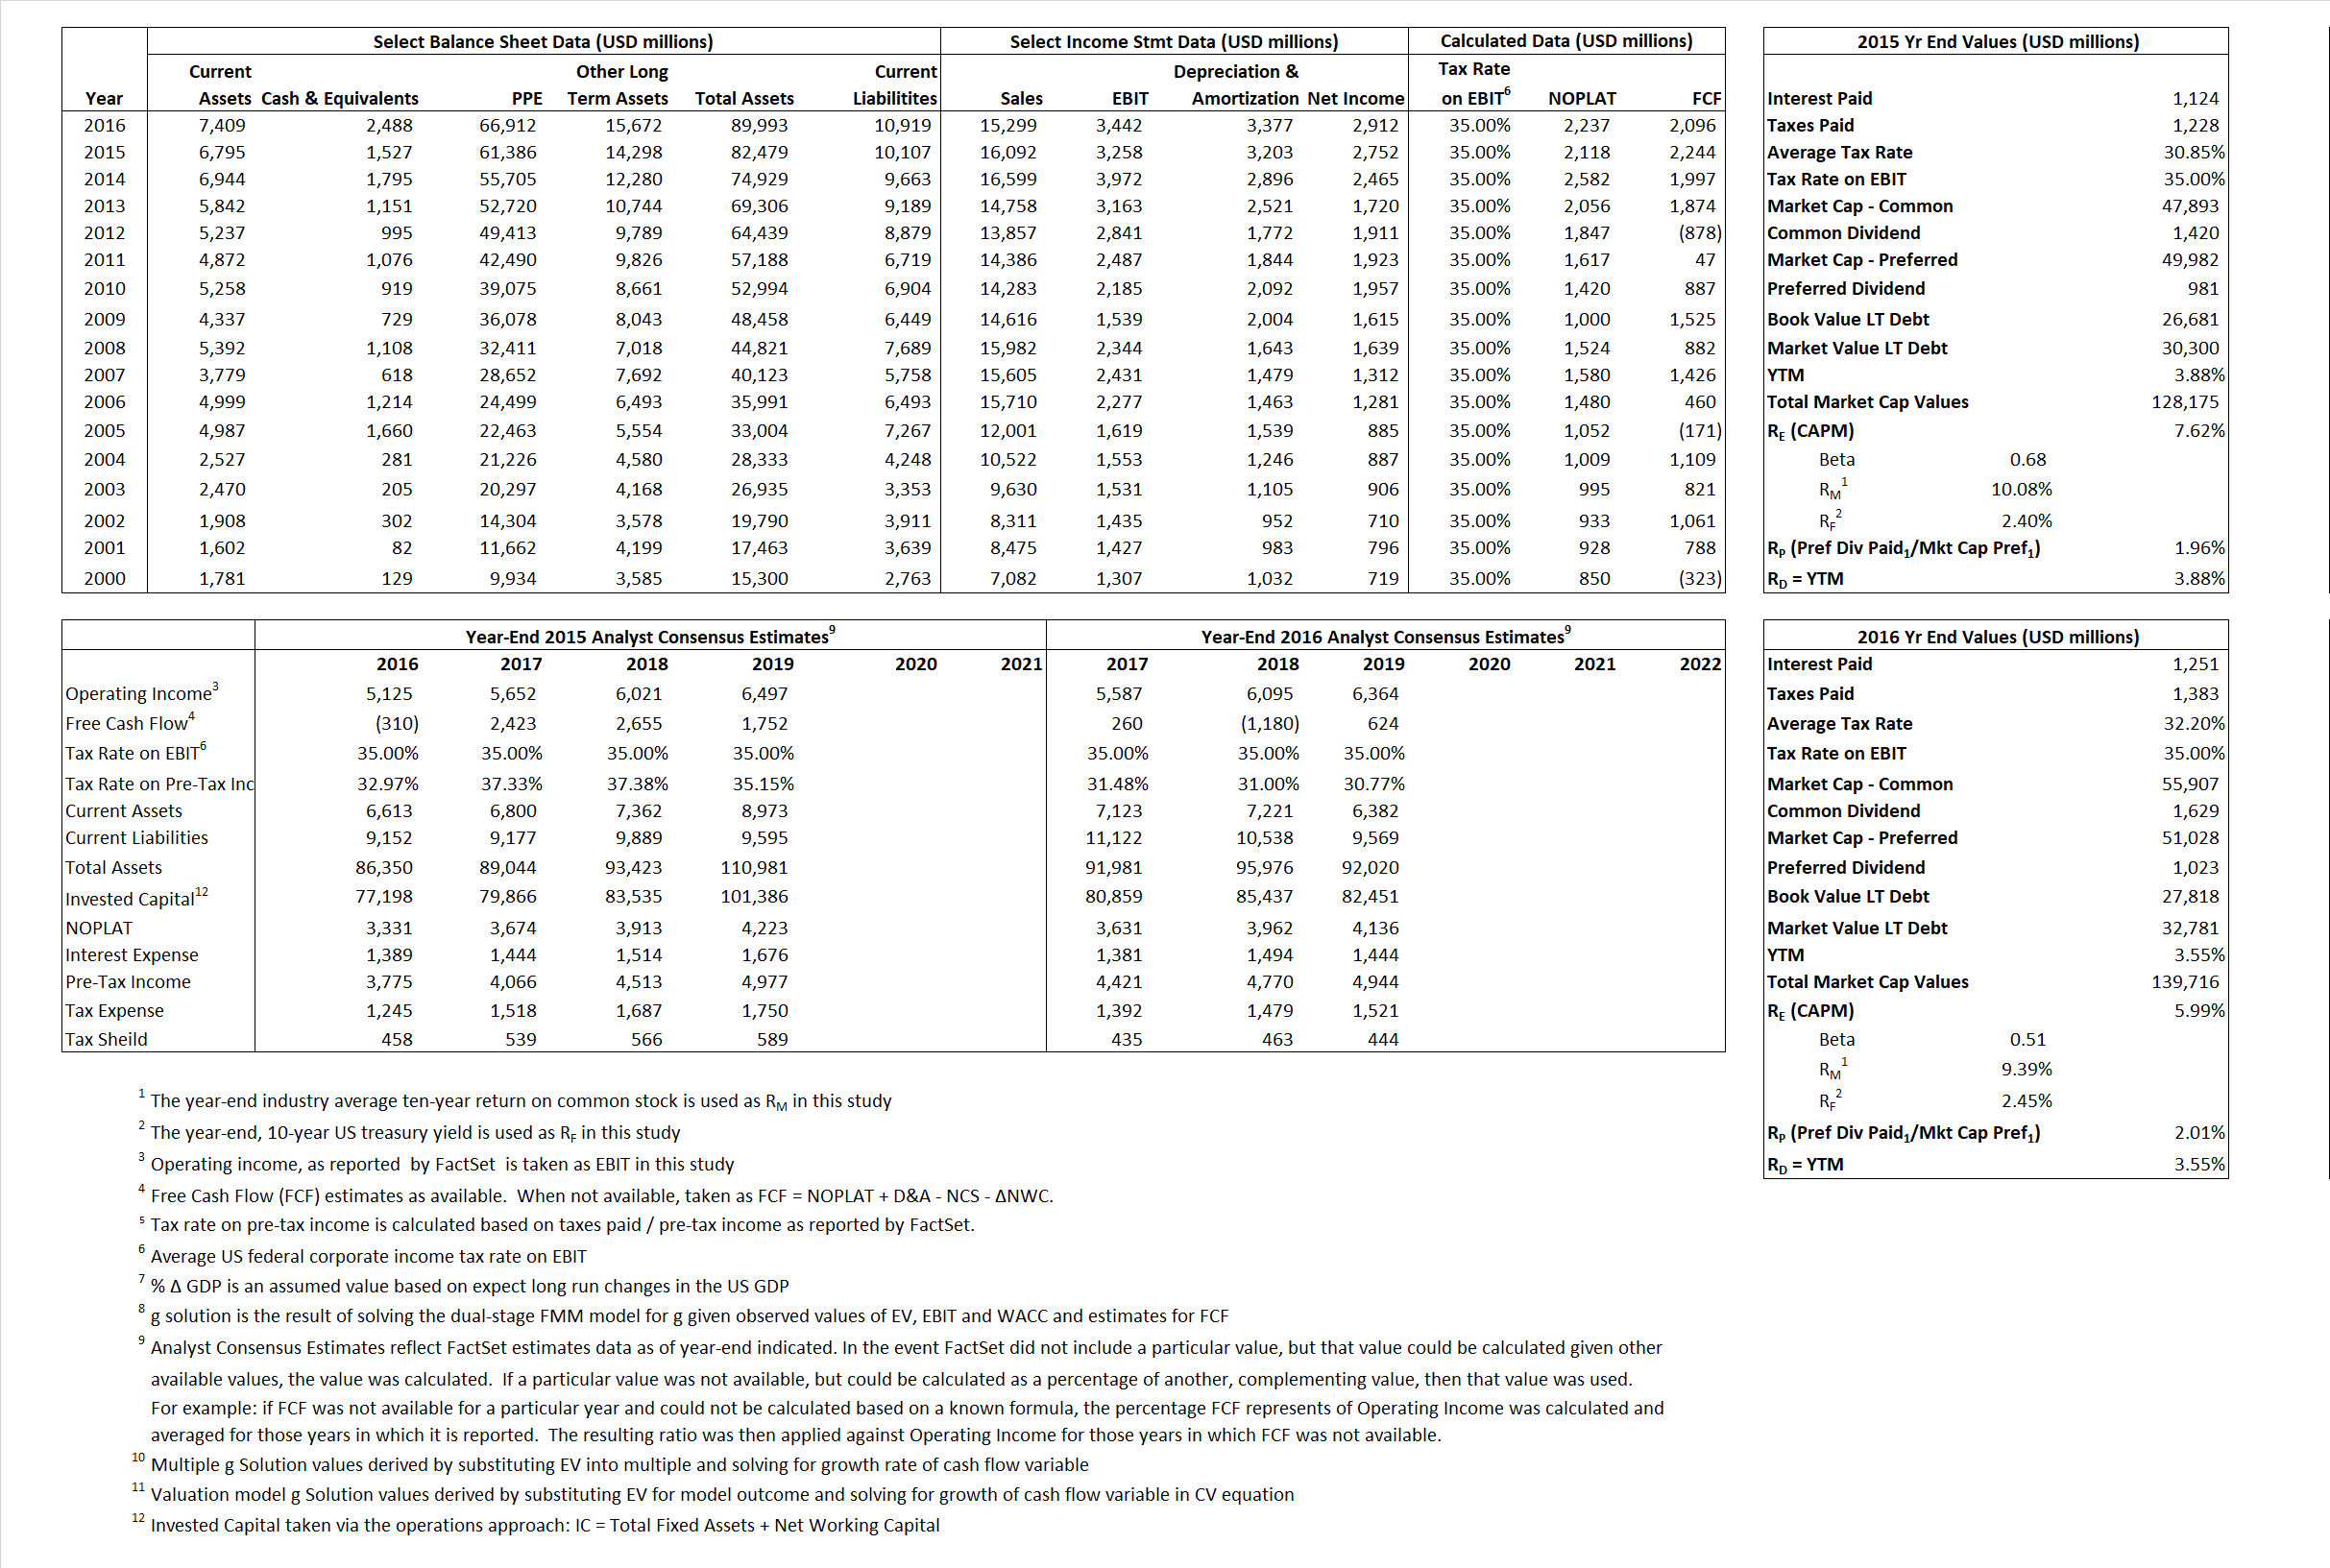
Primary Input Data
Derived Input Data
Derived Input |
Label |
2015 Value |
2016
|
Equational Form |
| Net Operating Profit Less Adjusted Taxes | NOPLAT | 2,118 | 2,237 |  |
| Free Cash Flow | FCF | 2,244 | 2,096 |  |
| Tax Shield | TS | 347 | 403 |  |
| Invested Capital | IC | 72,372 | 79,074 |  |
| Return on Invested Capital | ROIC | 2.93% | 2.83% |  |
| Net Investment | NetInv | 10,309 | 10,079 |  |
| Investment Rate | IR | 486.80% | 450.50% |  |
| Weighted Average Cost of Capital |
WACCMarket | 4.25% | 3.69% |  |
| WACCBook | 5.17% | 4.46% | ||
| Enterprise value |
EVMarket | 126,648 | 137,228 |  |
| EVBook | 122,068 | 132,265 | ||
| Long-Run Growth |
g = IR x ROIC |
14.24% | 12.75% | Long-run growth rates of the income variable are used in the Continuing Value portion of the valuation models. |
g = %  GDP GDP |
2.50% | 2.50% | ||
| Margin from Operations | M | 20.25% | 22.50% |  |
| Depreciation/Amortization Rate | D | 49.57% | 49.52% |  |
Valuation Multiple Outcomes
The outcomes presented in this study are the result of original input data, derived data, and synthesized inputs.
Equational Form |
Observed Value |
Single-stagemultiple g solution |
Two-stage valuationmodel g solution |
|||
| 12/31/2015 | 12/31/2016 | 12/31/2015 | 12/31/2016 | 12/31/2015 | 12/31/2016 | |
|
|
7.87 | 8.97 | 6.01% | 4.87% | 5.61% | 4.62% |
|
|
19.60 | 20.12 | 6.01% | 4.87% | 5.61% | 4.62% |
|
|
59.80 | 61.34 | 6.01% | 4.87% | 5.61% | 4.62% |
|
|
56.44 | 65.47 | 6.01% | 4.87% | 5.61% | 4.62% |
|
|
38.87 | 39.87 | 6.01% | 4.87% | 5.61% | 4.62% |
|
|
1.75 | 1.74 | 6.01% | 4.87% | 5.61% | 4.62% |


