Visa
Analyst Listings
The following analysts provide coverage for the subject firm as of May 2016:
| Broker | Analyst | Analyst Email |
| SunTrust Robinson Humphrey | Andrew Jeffrey | andrew.jeffrey@suntrust.com |
| Nomura Research | Bill Carcache | bill.carcache@nomura.com |
| Deutsche Bank Research | Bryan Keane | bryan.keane@db.com |
| Stifel Nicolaus | Christopher C. Brendler | ccbrendler@stifel.com |
| Atlantic Equities | Christopher Hickey | c.hickey@atlantic-equities.com |
| Sandler O’Neill & Partners | Christopher R. Donat | cdonat@sandleroneill.com |
| RBC Capital Markets | Daniel Perlin | daniel.perlin@rbccm.com |
| Evercore ISI | David Togut | david.togut@evercoreisi.com |
| Guggenheim Securities | Eric Wasserstrom | eric.wasserstrom@guggenheimpartners.com |
| Cowen & Company | Georgios Mihalos | george.mihalos@cowen.com |
| Wedbush Securities | Gil Luria | gil.luria@wedbush.com |
| Oppenheimer | Glenn Greene | glenn.greene@opco.com |
| BMO Capital Markets | James Fotheringham | james.fotheringham@bmo.com |
| Susquehanna Financial Group | James Friedman | james.friedman@sig.com |
| Piper Jaffray | Jason Deleeuw | jason.s.deleeuw@pjc.com |
| Jefferies | Jason Kupferberg | jkupferberg@jefferies.com |
| Compass Point Research | John T. Williams | jwilliams@compasspointllc.com |
| Pacific Crest Securities-KBCM | Josh Beck | jbeck@pacific-crest.com |
| Bernstein Research | Lisa D. Ellis | lisa.ellis@bernstein.com |
| CRT Capital Group | Moshe Katri | mkatri@sterneageecrt.com |
| Credit Suisse | Moshe Orenbuch | moshe.orenbuch@credit-suisse.com |
| William Blair | Robert Napoli | bnapoli@williamblair.com |
| Keefe Bruyette & Woods | Sanjay Sakhrani | ssakhrani@kbw.com |
| Wells Fargo Securities | Timothy Willi | timothy.willi@wellsfargo.com |
| Raymond James | Wayne Johnson | wayne.johnson@raymondjames.com |
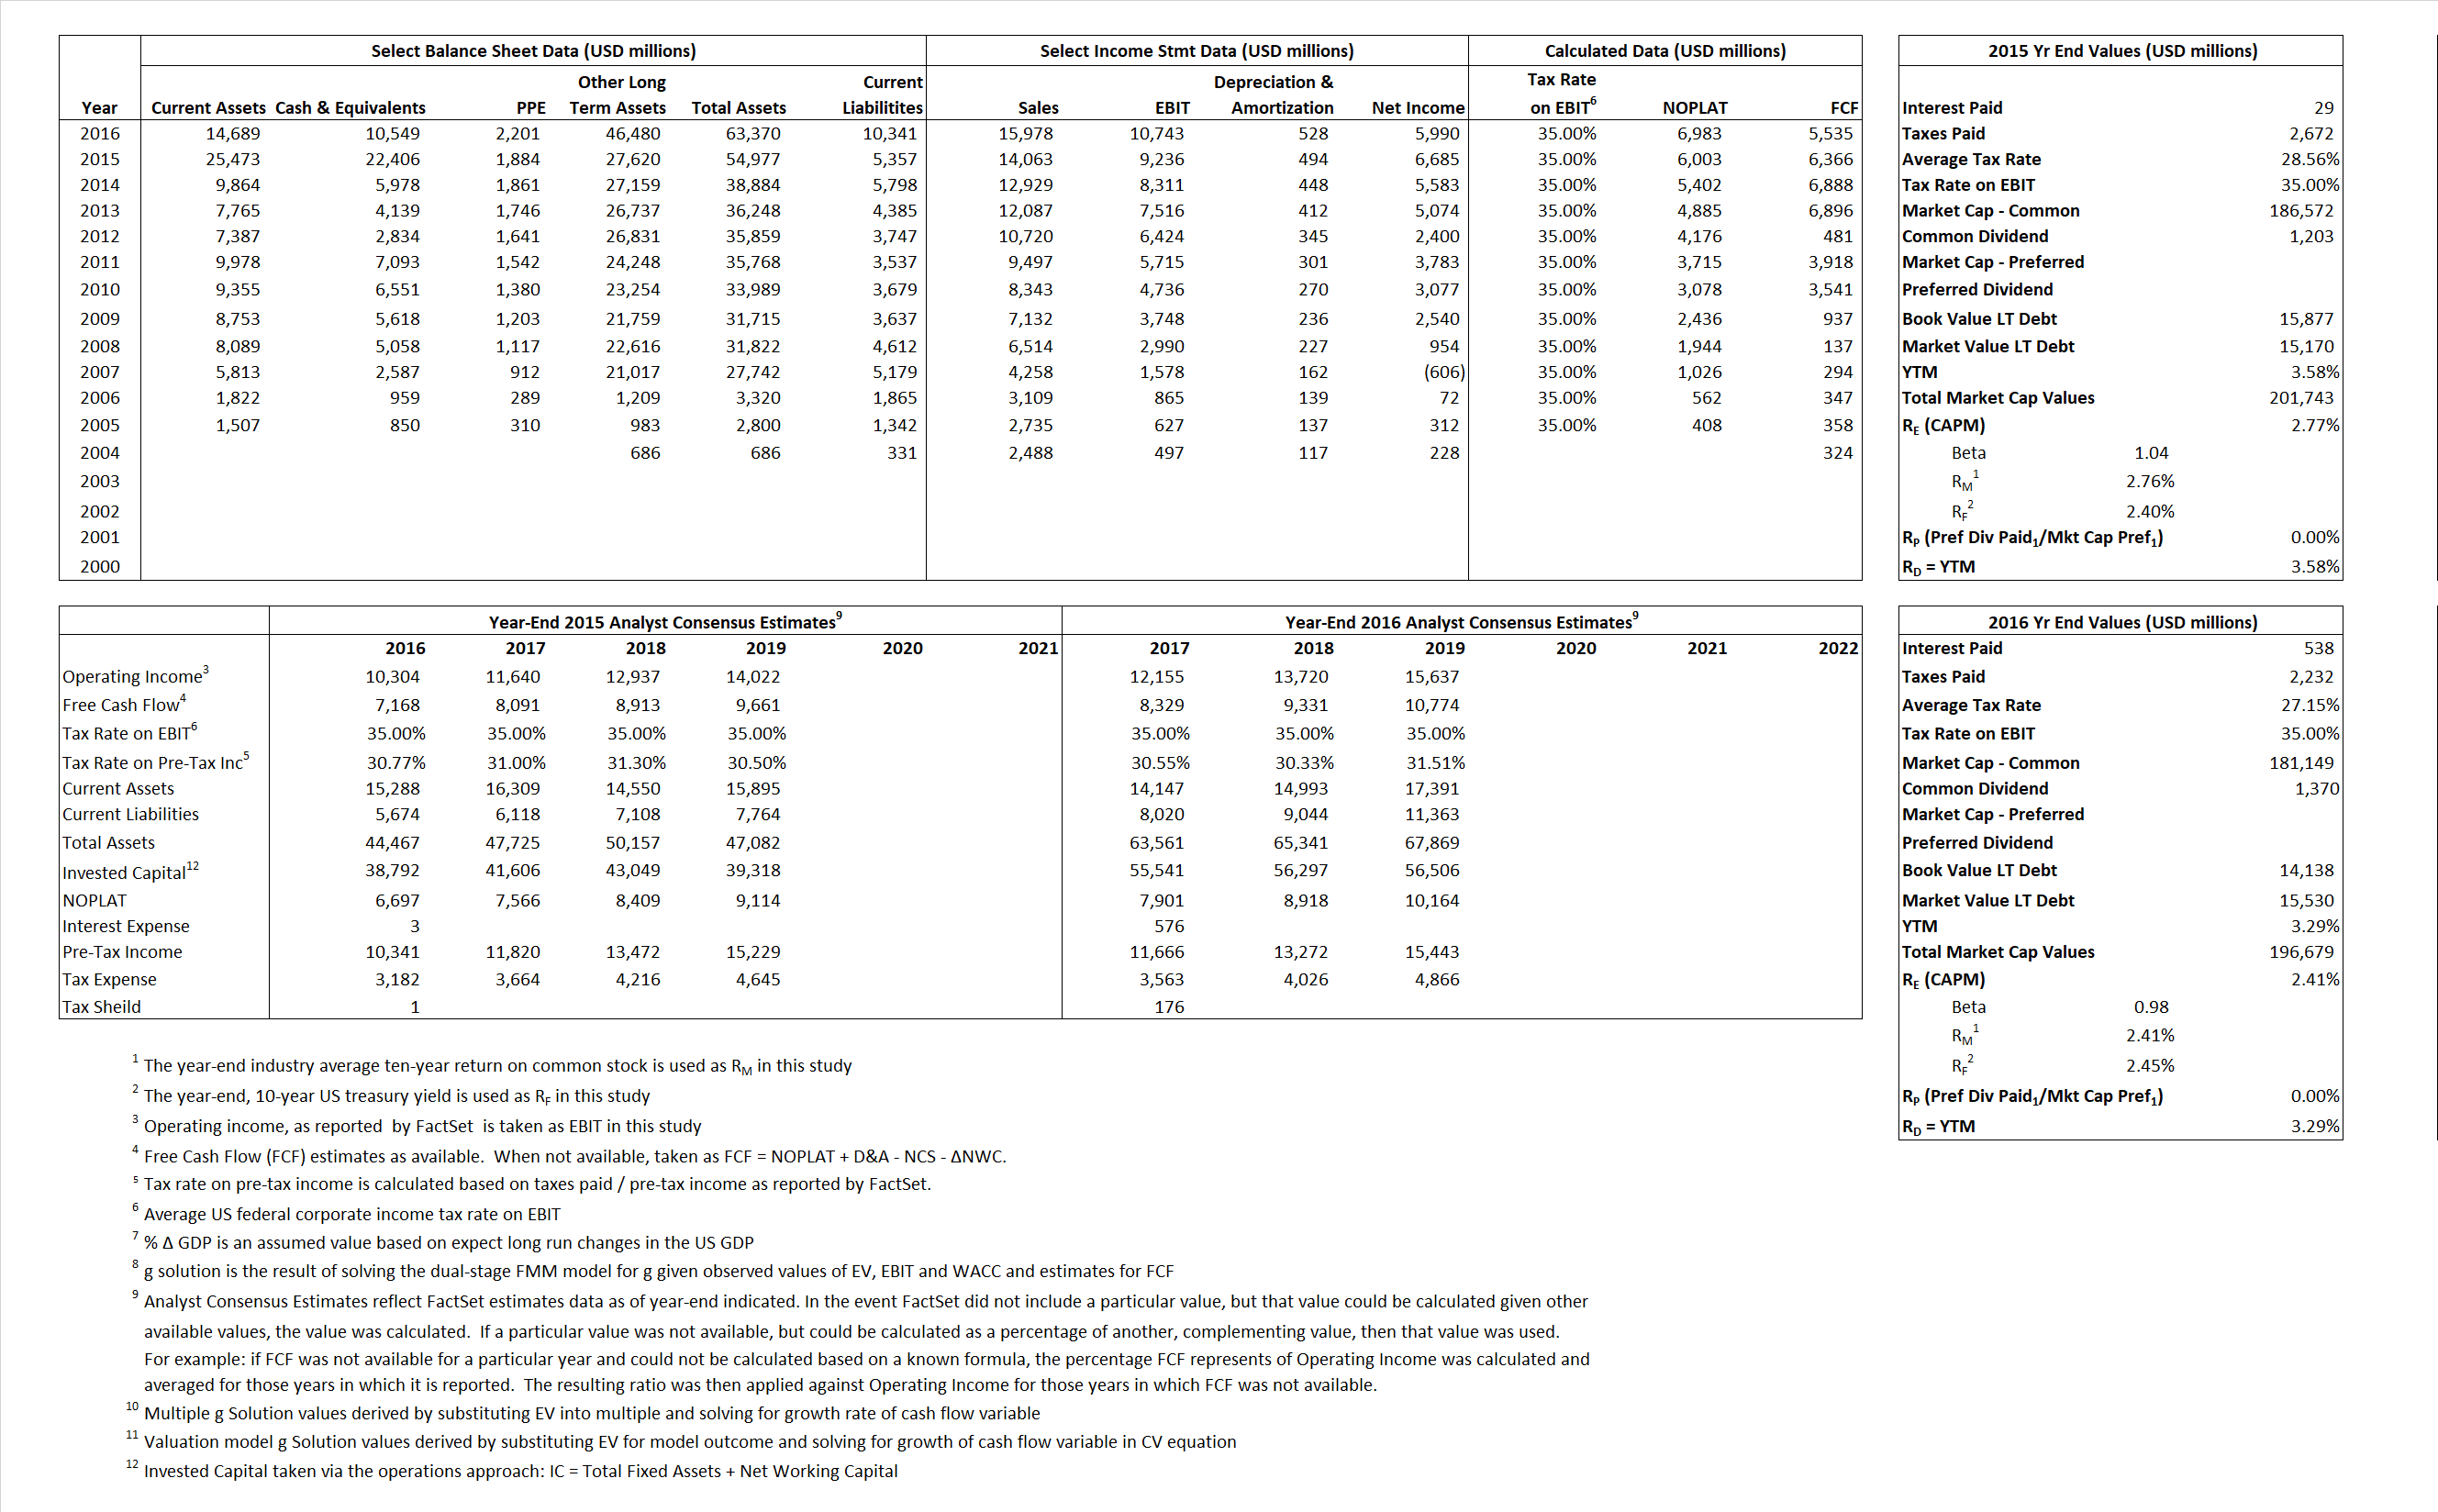
Primary Input Data
 Derived Input Data
Derived Input |
Label |
2015 Value |
2016
|
Equational Form |
| Net Operating Profit Less Adjusted Taxes | NOPLAT | 6,003 | 6,983 |  |
| Free Cash Flow | FCF | 6,366 | 5,535 |  |
| Tax Shield | TS | 8 | 146 |  |
| Invested Capital | IC | 49,620 | 53,029 |  |
| Return on Invested Capital | ROIC | 12.10% | 13.17% |  |
| Net Investment | NetInv | 17,028 | 3,937 |  |
| Investment Rate | IR | 283.64% | 56.38% |  |
| Weighted Average Cost of Capital |
WACCMarket | 2.76% | 2.41% |  |
| WACCBook | 9.19% | 8.20% | ||
| Enterprise value |
EVMarket | 179,337 | 174,273 |  |
| EVBook | 191,900 | 184,738 | ||
| Long-Run Growth |
g = IR x ROIC |
34.32% | 7.42% | Long-run growth rates of the income variable are used in the Continuing Value portion of the valuation models. |
g = %  GDP GDP |
2.50% | 2.50% | ||
| Margin from Operations | M | 65.68% | 67.24% |  |
| Depreciation/Amortization Rate | D | 5.08% | 4.68% |  |
Valuation Multiple Outcomes
The outcomes presented in this study are the result of original input data, derived data, and synthesized inputs.
Equational Form |
Observed Value |
Single-stagemultiple g solution |
Two-stage valuationmodel g solution |
|||
| 12/31/2015 | 12/31/2016 | 12/31/2015 | 12/31/2016 | 12/31/2015 | 12/31/2016 | |
|
|
12.75 | 10.91 | -0.81% | -2.30% | -1.27% | -1.84% |
|
|
18.43 | 15.46 | -0.81% | -2.30% | -1.27% | -1.84% |
|
|
29.87 | 24.96 | -0.81% | -2.30% | -1.27% | -1.84% |
|
|
28.17 | 31.49 | -0.81% | -2.30% | -1.27% | -1.84% |
|
|
19.42 | 16.22 | -0.81% | -2.30% | -1.27% | -1.84% |
|
|
3.61 | 3.29 | -0.81% | -2.30% | -1.27% | -1.84% |


