American International Group
Analyst Listing
The following analysts provide coverage for the subject firm as of May 2016:
| Broker | Analyst | Analyst Email |
| Wells Fargo Securities | Elyse Greenspan | elyse.greenspan@wellsfargo.com |
| FBR Capital Markets & Co | Randy Binner | rbinner@fbr.com |
| RBC Capital Markets | Mark Dwelle | mark.dwelle@rbccm.com |
| Bernstein Research | Josh Stirling | josh.stirling@bernstein.com |
| Atlantic Equities | John Heagerty | j.heagerty@atlantic-equities.com |
| Piper Jaffray | John Nadel | john.m.nadel@pjc.com |
| Sandler O’Neill & Partners | Paul Newsome | pnewsome@sandleroneill.com |
| Janney Montgomery Scott | Larry Greenberg | lgreenber@janney.com |
| Keefe Bruyette & Woods | Meyer Shields | mshields@kbw.com |
| William Blair | Adam Klauber | aklauber@williamblair.com |
| BMO Capital Markets | Charles J. Sebaski | charles.sebaski@bmo.com |
| Deutsche Bank Research | Joshua Shanker | joshua.shanker@db.com |
| Credit Suisse | Ryan Tunis | ryan.tunis@credit-suisse.com |
Primary Input Data
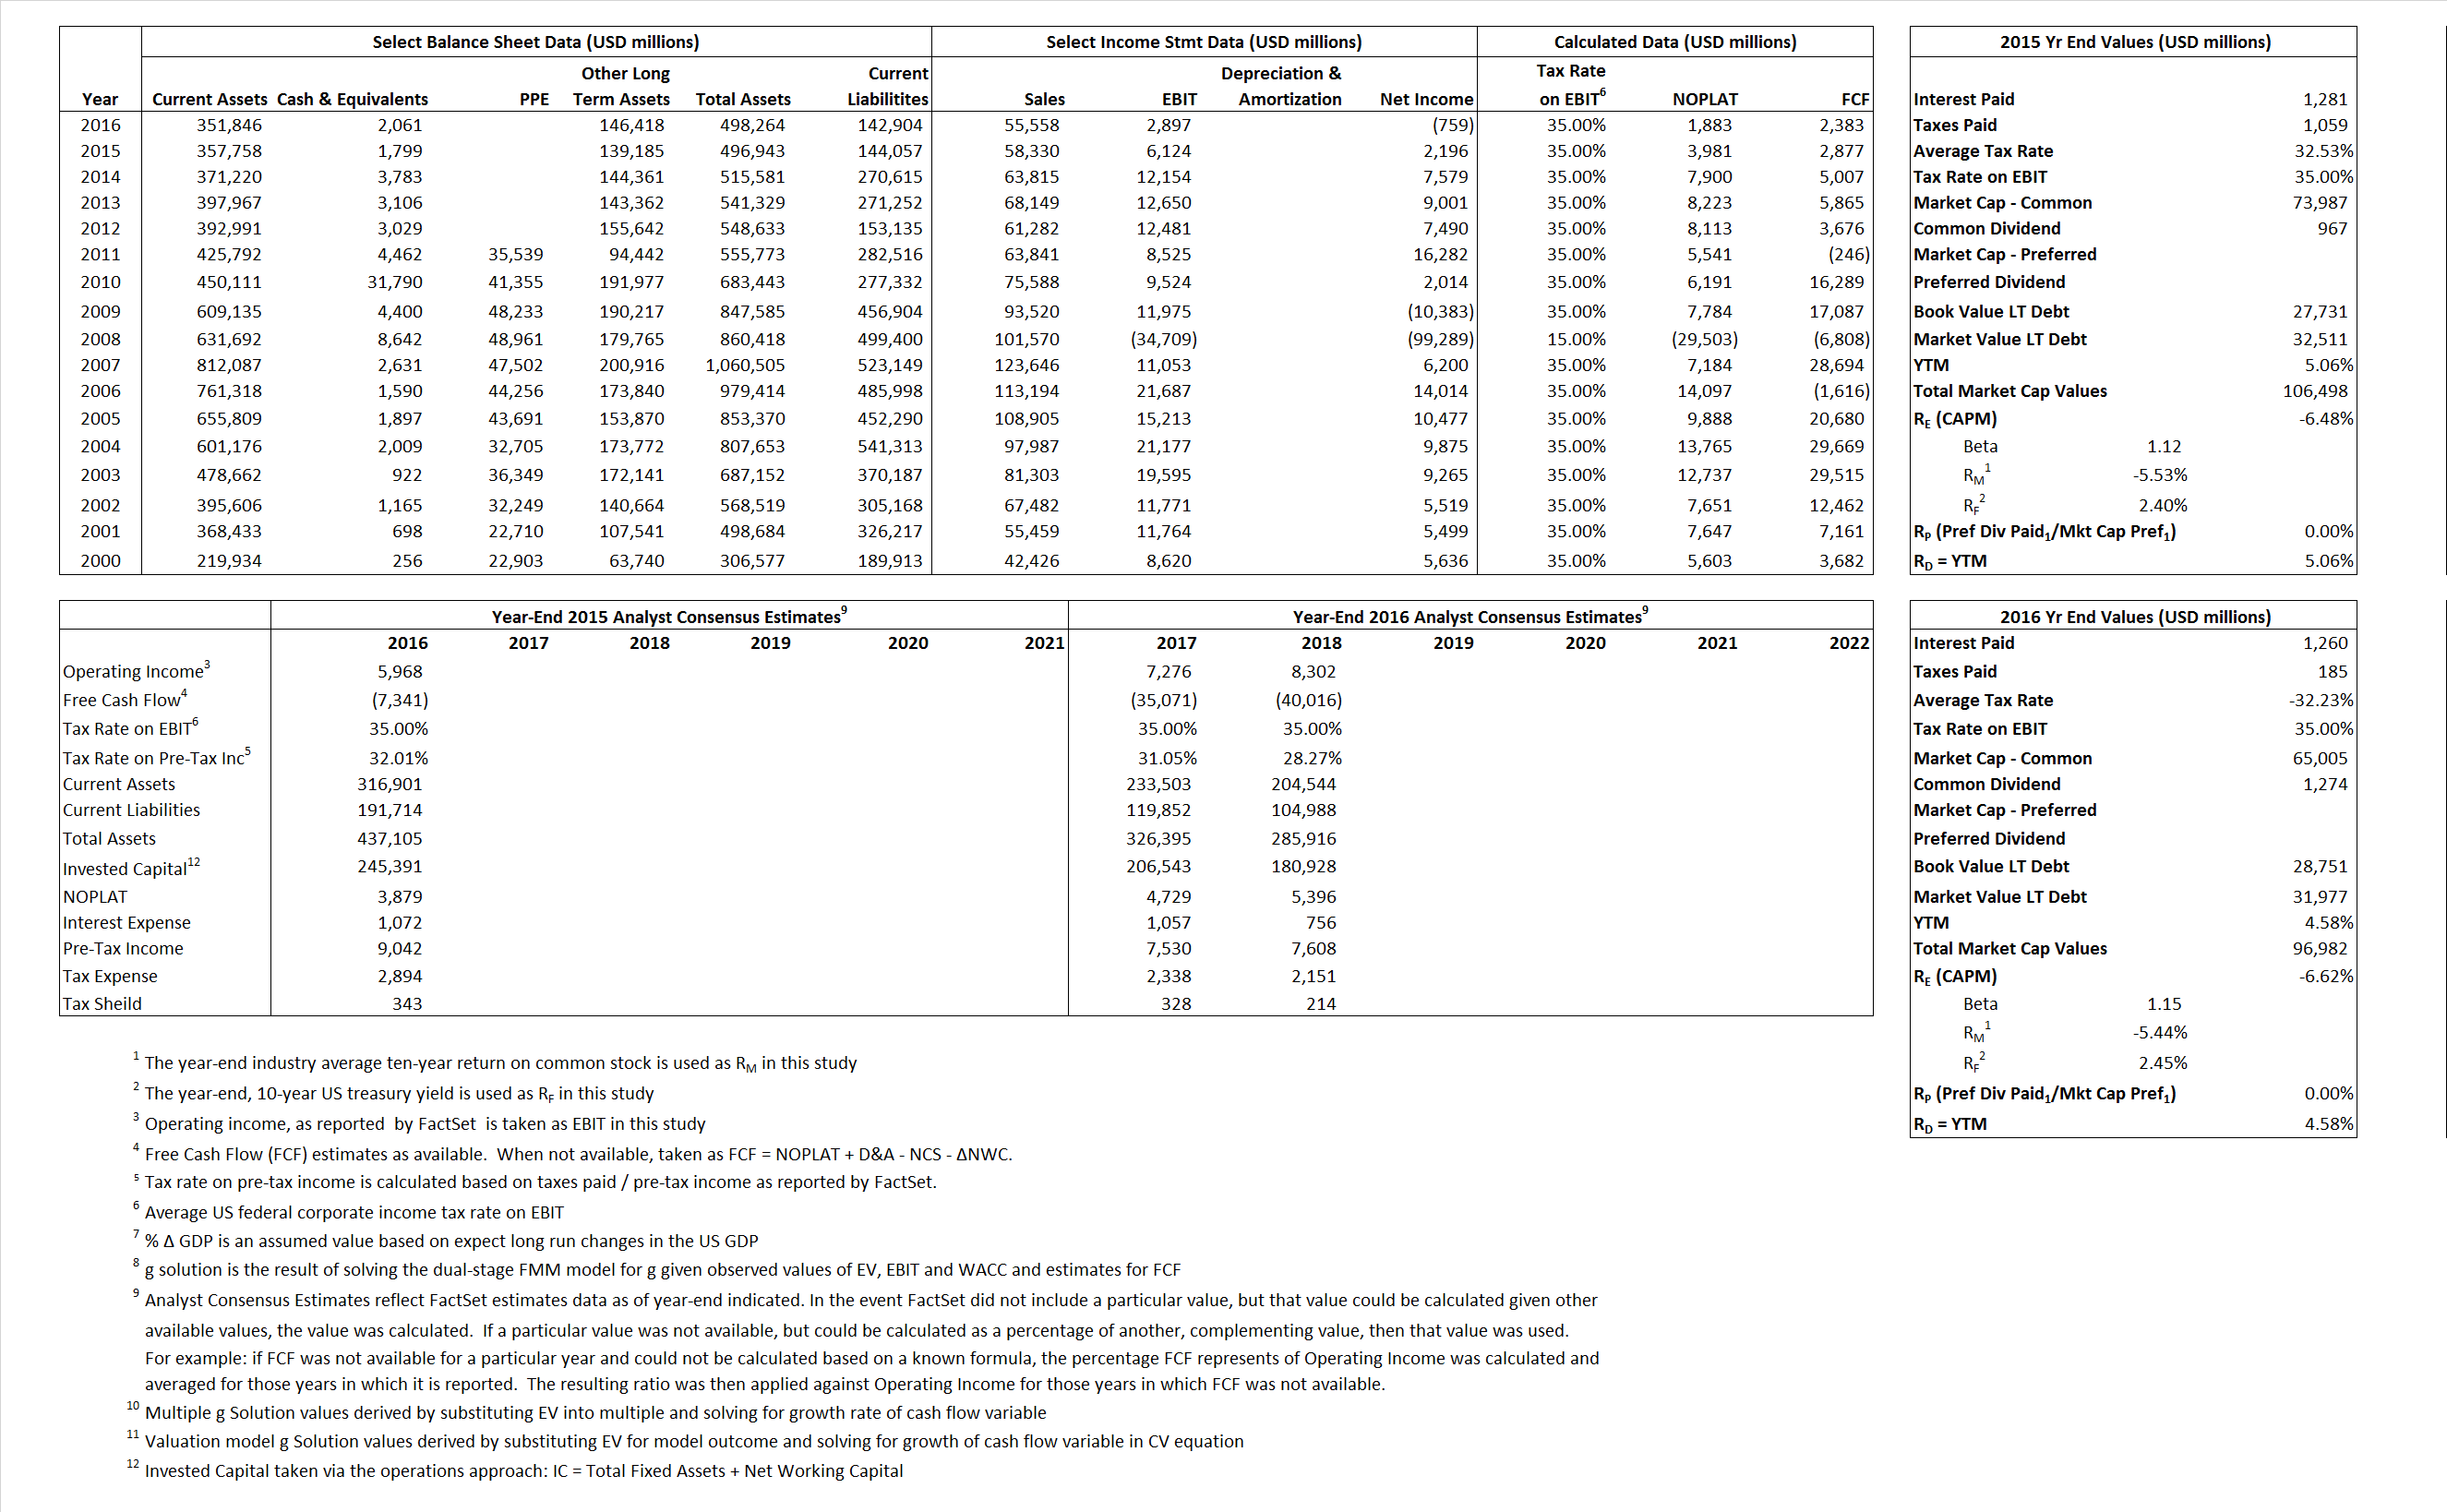
Derived Input Data
Derived Input |
Label |
2015 Value |
2016
|
Equational Form |
| Net Operating Profit Less Adjusted Taxes | NOPLAT | 3,981 | 1,883 |  |
| Free Cash Flow | FCF | 2,877 | 2,383 |  |
| Tax Shield | TS | 417 | (406) |  |
| Invested Capital | IC | 352,886 | 355,360 |  |
| Return on Invested Capital | ROIC | 1.13% | 0.53% |  |
| Net Investment | NetInv | 107,920 | 2,474 |  |
| Investment Rate | IR | 2,711.15% | 131.38% |  |
| Weighted Average Cost of Capital |
WACCMarket | -3.46% | -2.44% |  |
| WACCBook | 7.90% | 7.80% | ||
| Enterprise value |
EVMarket | 104,699 | 94,921 |  |
| EVBook | 99,919 | 91,695 | ||
| Long-Run Growth |
g = IR x ROIC |
30.58% | 0.70% | Long-run growth rates of the income variable are used in the Continuing Value portion of the valuation models. |
g = %  GDP GDP |
2.50% | 2.50% | ||
| Margin from Operations | M | 10.50% | 5.21% |  |
| Depreciation/Amortization Rate | D | 0.00% | 0.00% |  |
Valuation Multiple Outcomes
The outcomes presented in this study are the result of original input data, derived data, and synthesized inputs.
Equational Form |
Observed Value |
Single-stagemultiple g solution |
Two-stage valuationmodel g solution |
|||
| 12/31/2015 | 12/31/2016 | 12/31/2015 | 12/31/2016 | 12/31/2015 | 12/31/2016 | |
|
|
1.79 | 1.71 | 3.06% | 1.61% | 3.16% | 1.54% |
|
|
17.10 |
32.77 | 3.06% | 1.61% | 3.16% | 1.54% |
|
|
26.30 | 50.41 | 3.06% | 1.61% | 3.16% | 1.54% |
|
|
36.39 |
39.83 | 3.06% | 1.61% | 3.16% | 1.54% |
|
|
17.10 |
32.77 | 3.06% | 1.61% | 3.16% | 1.54% |
|
|
0.30 |
0.27 | 3.06% | 1.61% | 3.16% | 1.54% |


