Honeywell
Analyst Listing
The following analysts provide coverage for the subject firm as of May 2016:
| Broker | Analyst | Analyst Email |
| Morningstar | Barbara Noverini | barbara.noverini@morningstar.com |
| Langenberg, LLC | Brian K. Langenberg | brian@langenberg-llc.com |
| Oppenheimer | Christopher Glynn | christopher.glynn@opco.com |
| RBC Capital Markets | Deane M. Dray | deane.dray@rbccm.com |
| Cowen & Company | Gautam Khanna | gautam.khanna@cowen.com |
| Jefferies | Howard A. Rubel | hrubel@jefferies.com |
| Gabelli & Company | James Foung | jfoung@gabelli.com |
| Argus Research | John Eade | jeade@argusresearch.com |
| Deutsche Bank Research | John G. Inch | john.inch@db.com |
| Credit Suisse | Julian Mitchell | julian.mitchell@credit-suisse.com |
| William Blair | Nicholas P. Heymann | nheymann@williamblair.com |
| Sterne Agee CRT | Peter Arment | parment@sterneageecrt.com |
| Atlantic Equities | Richard Radbourne | r.radbourne@atlantic-equities.com |
| Drexel Hamilton | Richard Whittington | rwhittington@drexelhamilton.com |
| Stifel Nicolaus | Robert P. McCarthy | mccarthyr@stifel.com |
| Bernstein Research | Steven E. Winoker | steven.winoker@bernstein.com |
Primary Input Data
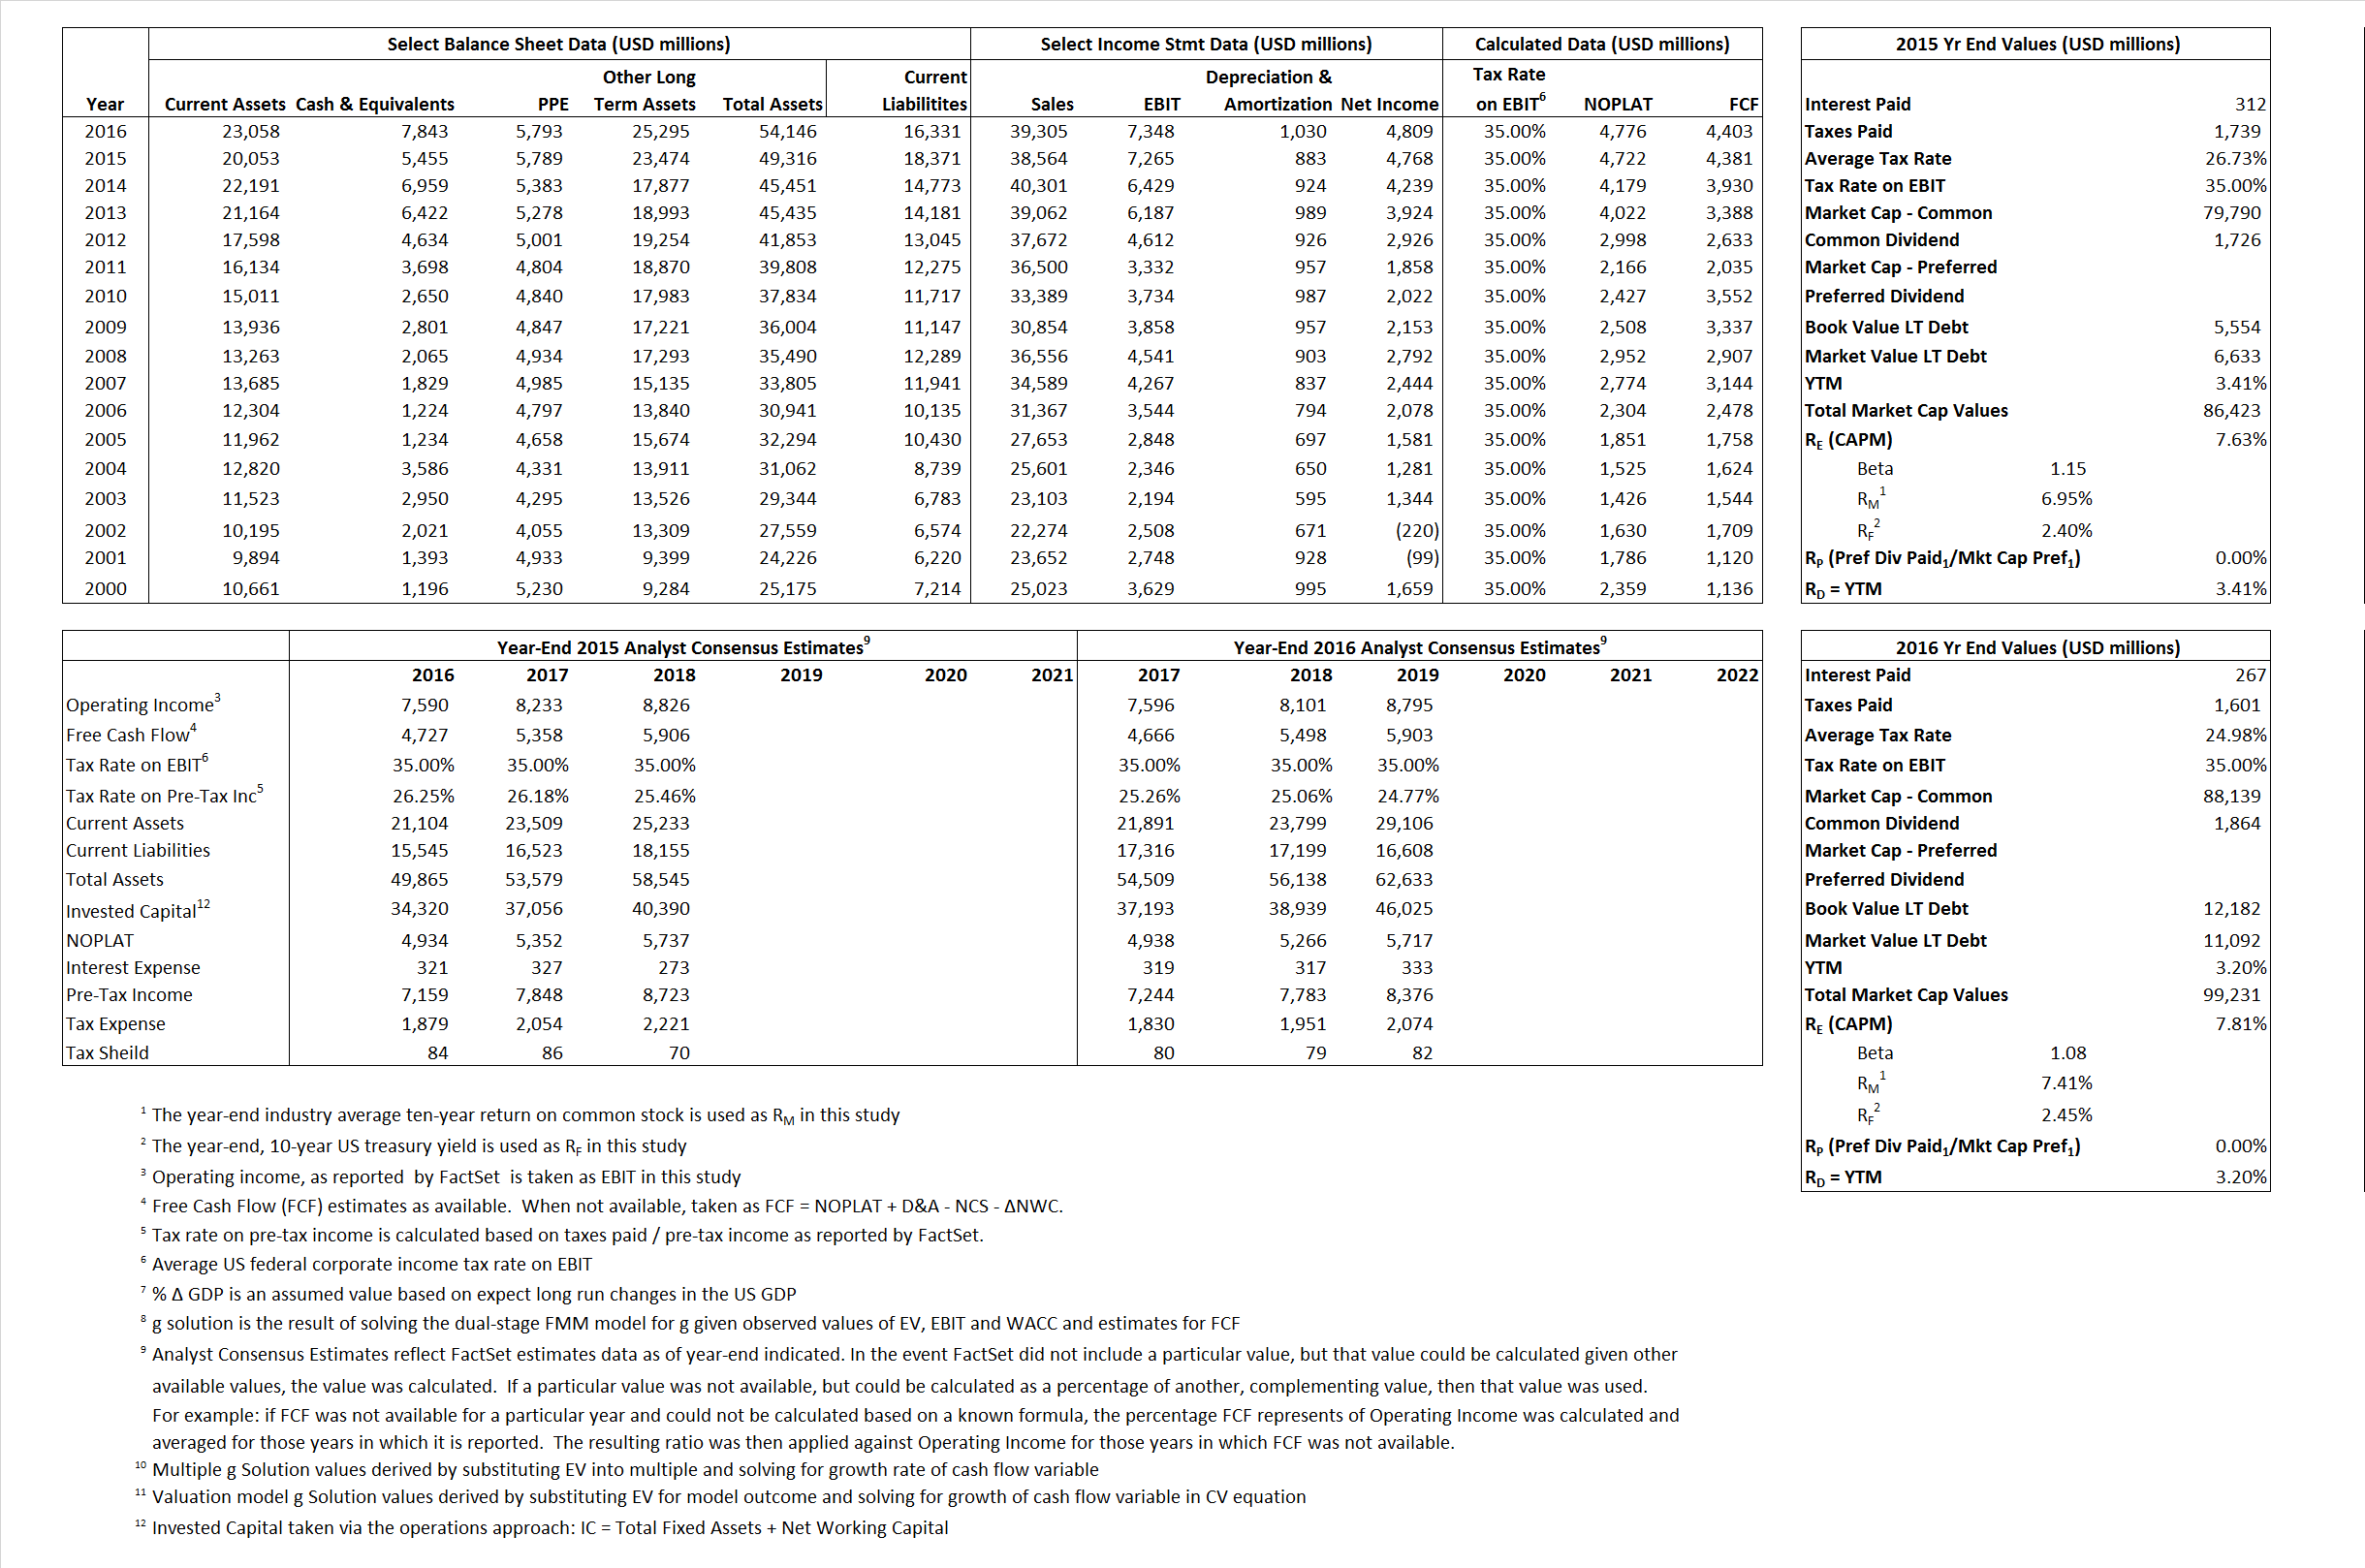
Derived Input Data
Derived Input |
Label |
2015 Value |
2016
|
Equational Form |
| Net Operating Profit Less Adjusted Taxes | NOPLAT | 4,722 | 4,776 |  |
| Free Cash Flow | FCF | 4,381 | 4,403 |  |
| Tax Shield | TS | 83 | 67 |  |
| Invested Capital | IC | 30,945 | 37,815 |  |
| Return on Invested Capital | ROIC | 15.26% | 12.63% |  |
| Net Investment | NetInv | 1,150 | 7,900 |  |
| Investment Rate | IR | 24.35% | 165.40% |  |
| Weighted Average Cost of Capital |
WACCMarket | 7.24% | 7.20% |  |
| WACCBook | 9.31% | 8.38% | ||
| Enterprise value |
EVMarket | 80,968 | 91,388 |  |
| EVBook | 79,889 | 92,478 | ||
| Long-Run Growth |
g = IR x ROIC |
3.72% | 20.89% | Long-run growth rates of the income variable are used in the Continuing Value portion of the valuation models. |
g = %  GDP GDP |
2.50% | 2.50% | ||
| Margin from Operations | M | 18.84% | 18.69% |  |
| Depreciation/Amortization Rate | D | 10.84% | 12.29% |  |
Valuation Multiple Outcomes
The outcomes presented in this study are the result of original input data, derived data, and synthesized inputs.
Equational Form |
Observed Value |
Single-stagemultiple g solution |
Two-stage valuationmodel g solution |
|||
| 12/31/2015 | 12/31/2016 | 12/31/2015 | 12/31/2016 | 12/31/2015 | 12/31/2016 | |
|
|
2.10 | 2.33 | 2.28% | 3.37% | 2.45% | 4.46% |
|
|
9.94 | 10.91 | 2.28% | 3.37% | 2.45% | 4.46% |
|
|
17.25 | 19.13 | 2.28% | 3.37% | 2.45% | 4.46% |
|
|
18.48 | 20.76 | 2.28% | 3.37% | 2.45% | 4.46% |
|
|
11.14 | 12.44 | 2.28% | 3.37% | 2.45% | 4.46% |
|
|
2.62 | 2.42 | 2.28% | 3.37% | 2.45% | 4.46% |


