EMC Corporation
Analyst Listing
The following analysts provide coverage for the subject firm as of May 2016:
| Broker | Analyst | Analyst Email |
| Stifel Nicolaus | Aaron Rakers | rakersa@stifel.com |
| Mizuho Securities USA | Abhey Lamba | abhey.lamba@us.mizuho-sc.com |
| CRT Capital Group | Alex Kurtz | akurtz@sterneageecrt.com |
| RBC Capital Markets | Amit Daryanani | amit.daryanani@rbccm.com |
| Brean Capital, LLC | Ananda Baruah | abaruah@breancapital.com |
| Piper Jaffray | Andrew J. Nowinski | andrew.j.nowinski@pjc.com |
| Pacific Crest Securities-KBCM | Brent Bracelin | bbracelin@pacific-crest.com |
| Raymond James | Brian G. Alexander | brian.alexander@raymondjames.com |
| Drexel Hamilton | Brian J. White | bwhite@drexelhamilton.com |
| Oppenheimer | Ittai Kidron | ittai.kidron@opco.com |
| Jefferies | James Kisner | jkisner@jefferies.com |
| William Blair | Jason Ader | jader@williamblair.com |
| Longbow Research | Joe Wittine | jwittine@longbowresearch.com |
| Atlantic Equities | Josep Bori | j.bori@atlantic-equities.com |
| Wells Fargo Securities | Maynard J. Um | maynard.um@wellsfargo.com |
| Susquehanna Financial Group | Mehdi Hosseini | mehdi.hosseini@sig.com |
| Maxim Group | Nehal Chokshi | nehalchokshi@techinsightsresearch.com |
| FBN Securities | Shebly Seyrafi | sseyrafi@fbnsecurities.com |
| Deutsche Bank Research | Sherri Scribner | sherri.scribner@db.com |
| Summit Research | Srini Nandury | srini@summitresearchllc.com |
| Hilliard Lyons | Stephen Turner | sturner@hilliard.com |
| Cross Research | Steven Fox | steven@crossresearch.com |
| Bernstein Research | Toni M. Sacconaghi Jr | sacconaghi@bernstein.com |
| Daiwa Securities Co. Ltd. | Yoko Yamada | yoko.yamada@us.daiwacm.com |
Primary Input Data
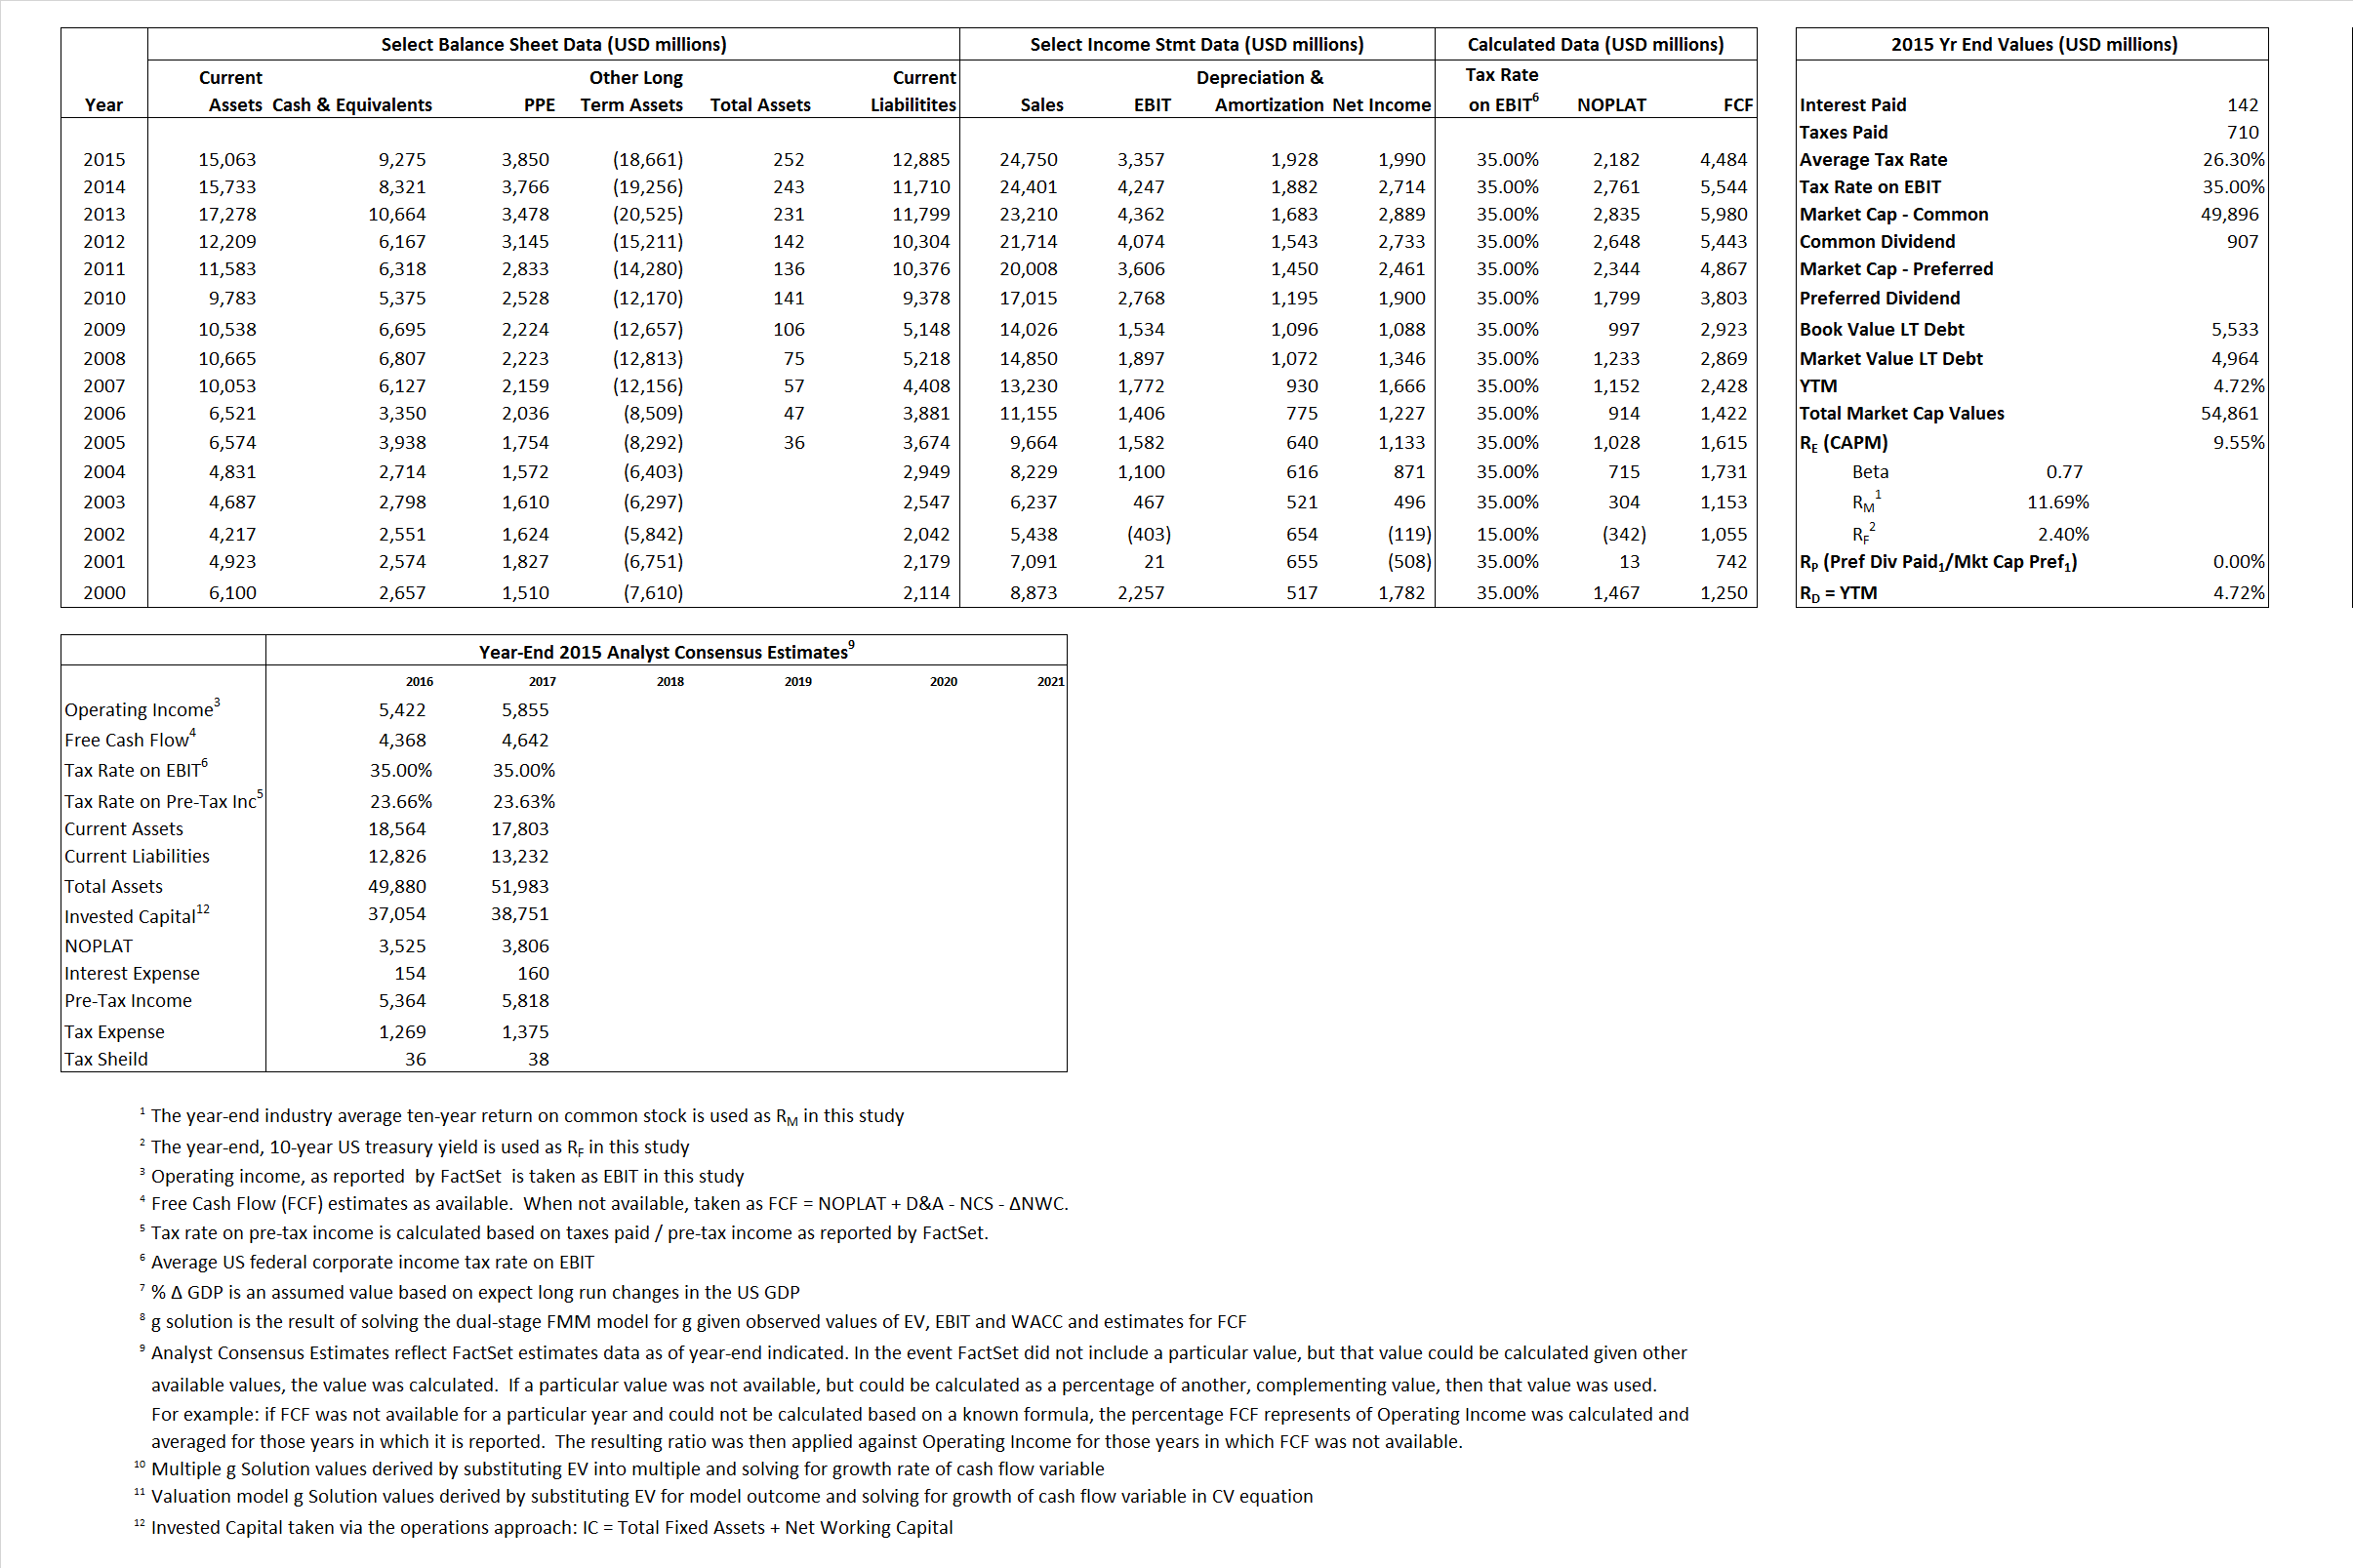
Derived Input Data
Derived Input |
Label |
2015 Value |
2016
|
Equational Form |
| Net Operating Profit Less Adjusted Taxes | NOPLAT | 2,182 |  |
|
| Free Cash Flow | FCF | 4,484 |  |
|
| Tax Shield | TS | 37 |  |
|
| Invested Capital | IC | (12,633) |  |
|
| Return on Invested Capital | ROIC | -17.27% |  |
|
| Net Investment | NetInv | 763 |  |
|
| Investment Rate | IR | 34.95% |  |
|
| Weighted Average Cost of Capital |
WACCMarket | 9.00% |  |
|
| WACCBook | 8.91% | |||
| Enterprise value |
EVMarket | 45,586 |  |
|
| EVBook | 46,154 | |||
| Long-Run Growth |
g = IR x ROIC |
-6.04% | Long-run growth rates of the income variable are used in the Continuing Value portion of the valuation models. | |
g = %  GDP GDP |
2.50% | |||
| Margin from Operations | M | 13.56% |  |
|
| Depreciation/Amortization Rate | D | 36.48% |  |
Valuation Multiple Outcomes
The outcomes presented in this study are the result of original input data, derived data, and synthesized inputs.
Equational Form |
Observed Value |
Single-stagemultiple g solution |
Two-stage valuationmodel g solution |
|||
| 12/31/2015 | 12/31/2016 | 12/31/2015 | 12/31/2016 | 12/31/2015 | 12/31/2016 | |
|
|
1.84 | 3.30% | 3.22% | |||
|
|
8.63 | 3.30% | 3.22% | |||
|
|
20.89 | 3.30% | 3.22% | |||
|
|
10.17 | 3.30% | 3.22% | |||
|
|
13.58 | 3.30% | 3.22% | |||
|
|
-3.61 | 3.30% | 3.22% | |||


