METLIFE
Analyst Listing
The following analysts provide coverage for the subject firm as of May 2016:
| Broker | Analyst | Analyst Email |
| Morningstar | Brett Horn | brett.horn@morningstar.com |
| RBC Capital Markets | Eric N. Berg | eric.berg@rbccm.com |
| Dowling & Partners | Humphrey A. Lee | humphrey@dowling.com |
| Argus Research | Jacob Kilstein | jkilstein@argusresearch.com |
| Sandler O’Neill & Partners | John Barnidge | jbarnidge@sandleroneill.com |
| Atlantic Equities | John Heagerty | j.heagerty@atlantic-equities.com |
| Piper Jaffray | John Nadel | john.m.nadel@pjc.com |
| Daiwa Securities Co. Ltd. | Kazuki Watanabe | kazuki.watanabe@daiwa.co.jp |
| Janney Montgomery Scott | Larry Greenberg | lgreenberg@janney.com |
| FBR Capital Markets & Co | Randy Binner | rbinner@fbr.com |
| Keefe Bruyette & Woods | Ryan Krueger | rkrueger@kbw.com |
| Raymond James | Steven D. Schwartz | steven.schwartz@raymondjames.com |
| Deutsche Bank Research | Yaron Kinar | yaron.kinar@db.com |
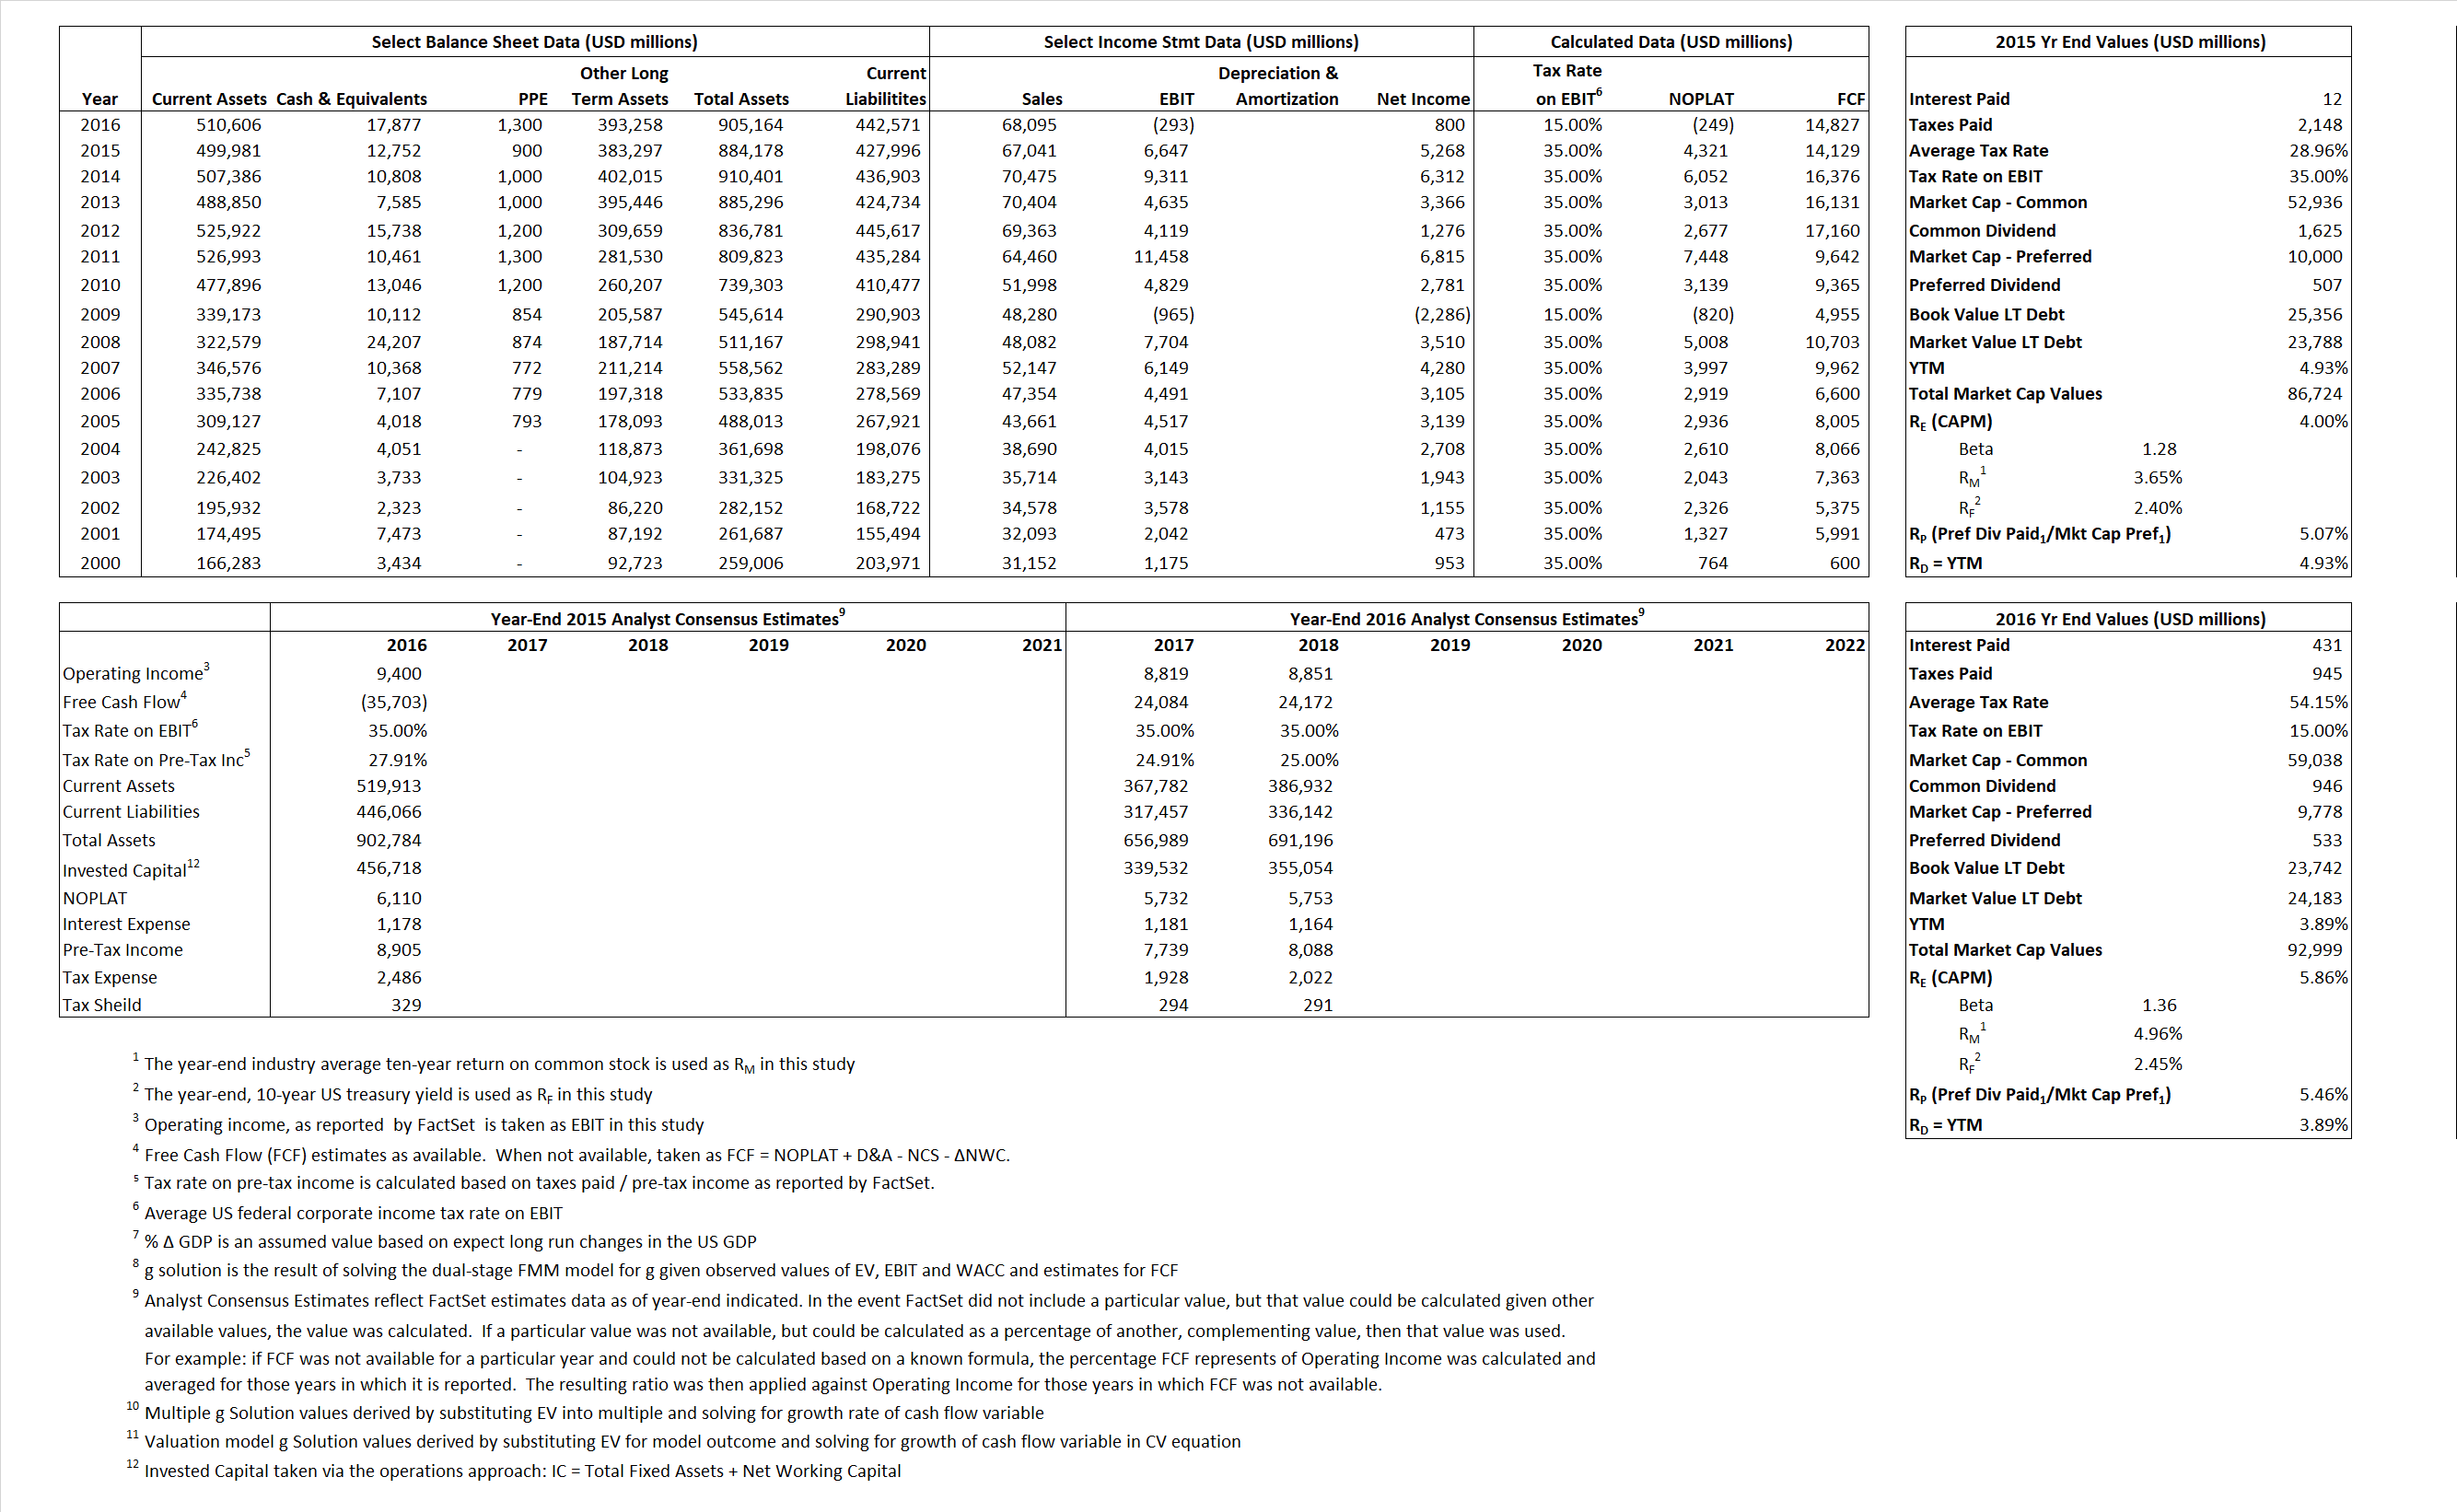
Primary Input Data
Derived Input Data
Derived Input |
Label |
2015 Value |
2016
|
Equational Form |
| Net Operating Profit Less Adjusted Taxes | NOPLAT | 4,321 | (249) |  |
| Free Cash Flow | FCF | 14,129 | 14,827 |  |
| Tax Shield | TS | 3 | 233 |  |
| Invested Capital | IC | 456,182 | 462,593 |  |
| Return on Invested Capital | ROIC | 0.95% | -0.05% |  |
| Net Investment | NetInv | (17,316) | 6,411 |  |
| Investment Rate | IR | -400.78% | -2,574.18% |  |
| Weighted Average Cost of Capital |
WACCMarket | 3.99% | 4.76% |  |
| WACCBook | 8.24% | 1.36% | ||
| Enterprise value |
EVMarket | 73,972 | 75,122 |  |
| EVBook | 70,415 | 74,681 | ||
| Long-Run Growth |
g = IR x ROIC |
-3.80% | 1.39% | Long-run growth rates of the income variable are used in the Continuing Value portion of the valuation models. |
g = %  GDP GDP |
2.50% | 2.50% | ||
| Margin from Operations | M | 9.91% | -0.43% |  |
| Depreciation/Amortization Rate | D | 0.00% | 0.00% |  |
Valuation Multiple Outcomes
The outcomes presented in this study are the result of original input data, derived data, and synthesized inputs.
Equational Form |
Observed Value |
Single-stagemultiple g solution |
Two-stage valuationmodel g solution |
|||
| 12/31/2015 | 12/31/2016 | 12/31/2015 | 12/31/2016 | 12/31/2015 | 12/31/2016 | |
|
|
1.10 | 1.10 | 0.36% | -0.99% | -O.05% | -1.10% |
|
|
11.13 | -256.39 | 0.36% | -0.99% | -O.05% | -1.10% |
|
|
17.12 | -301.63 | 0.36% | -0.99% | -O.05% | -1.10% |
|
|
5.24 | 5.07 | 0.36% | -0.99% | -O.05% | -1.10% |
|
|
11.13 | -256.39 | 0.36% | -0.99% | -O.05% | -1.10% |
|
|
0.16 | 0.16 | 0.36% | -0.99% | -O.05% | -1.10% |


