United Parcel Service Inc
Analyst Listing
The following analysts provide coverage for the subject firm as of May 2016:
| Broker | Analyst | Analyst Email |
| Credit Suisse | Allison M. Landry | allison.landry@credit-suisse.com |
| Raymond James | Arthur W. Hatfield | art.hatfield@raymondjames.com |
| Susquehanna Financial Group | Bascome Majors | bascome.majors@sig.com |
| Stifel Nicolaus | David G. Ross | dross@stifel.com |
| Bernstein Research | David Vernon | david.vernon@bernstein.com |
| Avondale Partners | Donald Broughton | dbroughton@avondalepartnersllc.com |
| Cowen & Company | Helane Becker | helane.becker@cowen.com |
| Stephens Inc | Jack Atkins | jack.atkins@stephens.com |
| Buckingham Research | Jeffrey Kauffman | jkauffman@buckresearch.com |
| RBC Capital Markets | John Barnes | john.barnes@rbccm.com |
| BB&T Capital Markets | Kevin W. Sterling | ksterling@bbandtcm.com |
| Nomura Research | Matt Troy | matt.troy@nomura.com |
| William Blair | Nathan Brochmann | nbrochmann@williamblair.com |
| Deutsche Bank Research | Robert Salmon | robert.salmon@db.com |
| Wolfe Research | Scott H. Group | sgroup@wolferesearch.com |
| Oppenheimer | Scott Schneeberger | scott.schneeberger@opco.com |
Primary Input Data
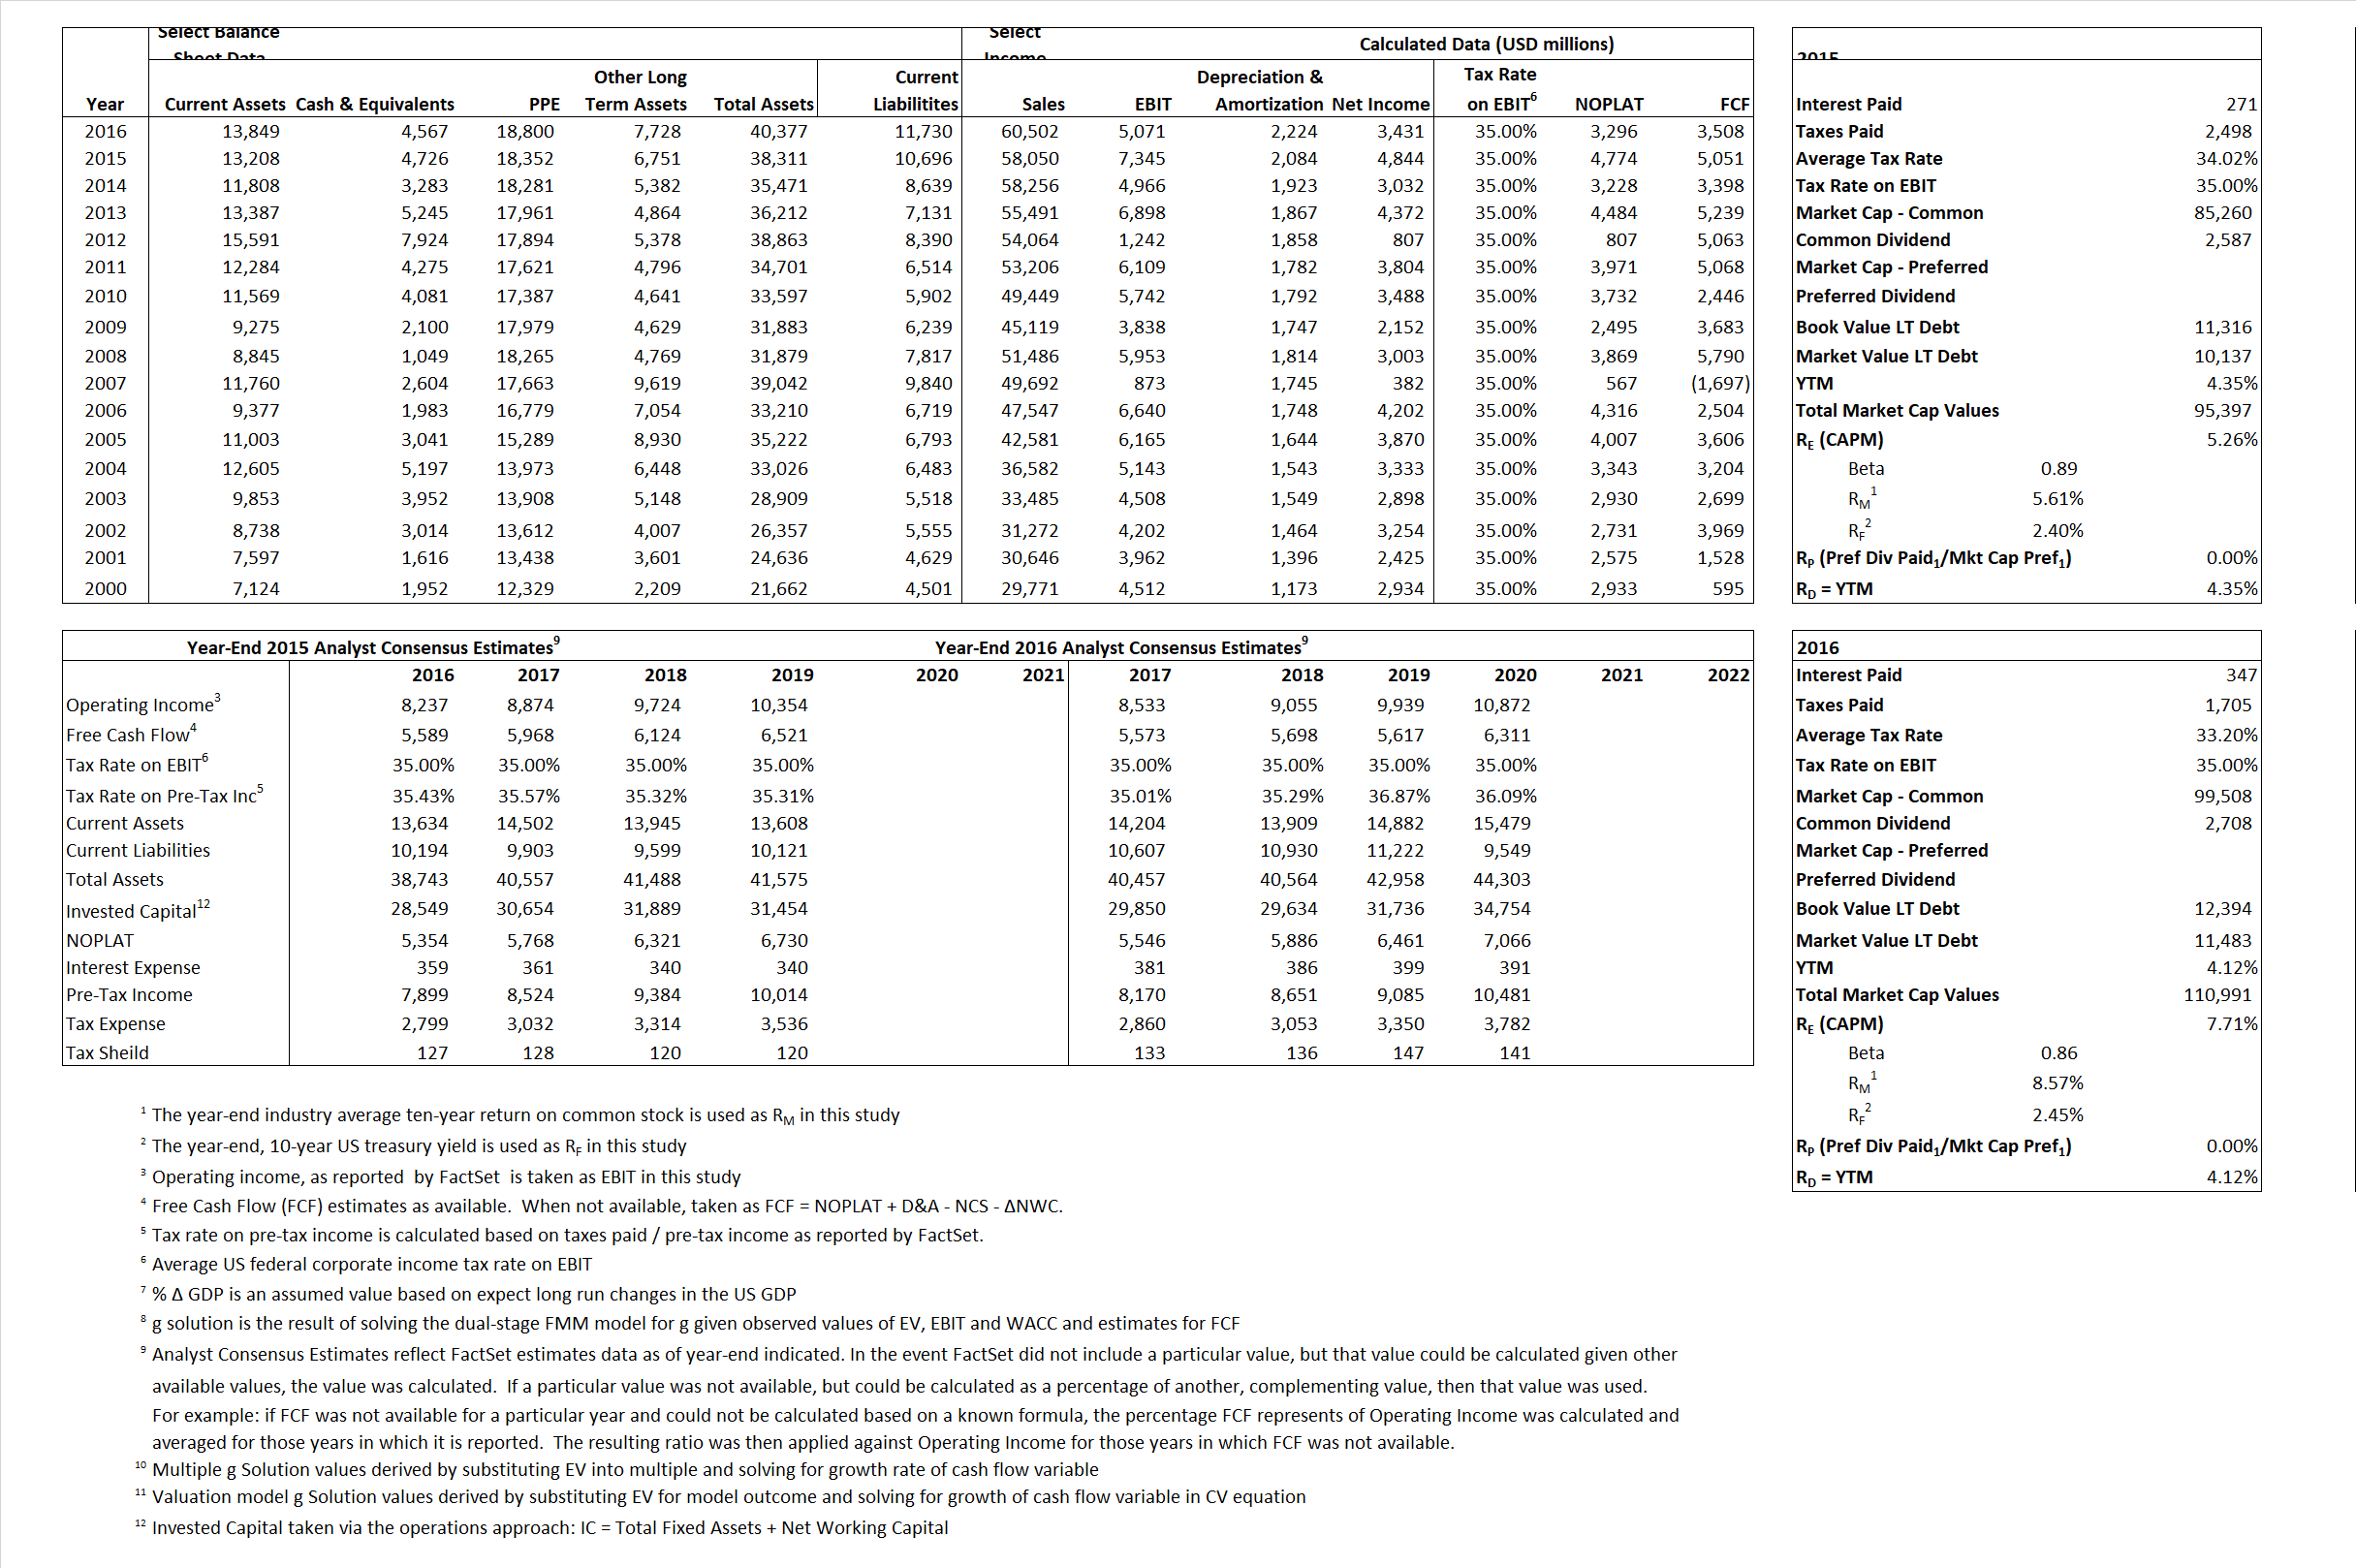
Derived Input Data
Derived Input |
Label |
2015 Value |
2016
|
Equational Form |
| Net Operating Profit Less Adjusted Taxes | NOPLAT | 4,774 | 3,296 |  |
| Free Cash Flow | FCF | 5,051 | 4,774 |  |
| Tax Shield | TS | 92 | 115 |  |
| Invested Capital | IC | 27,615 | 28,647 |  |
| Return on Invested Capital | ROIC | 17.29% | 11.51% |  |
| Net Investment | NetInv | 2,867 | 3,256 |  |
| Investment Rate | IR | 60.05% | 98.78% |  |
| Weighted Average Cost of Capital |
WACCMarket | 5.00% | 7.20% |  |
| WACCBook | 7.62% | 7.17% | ||
| Enterprise value |
EVMarket | 90,671 | 106,424 |  |
| EVBook | 92,009 | 107,335 | ||
| Long-Run Growth |
g = IR x ROIC |
10.38% | 11.37% | Long-run growth rates of the income variable are used in the Continuing Value portion of the valuation models. |
g = %  GDP GDP |
2.50% | 2.50% | ||
| Margin from Operations | M | 12.65% | 8.38% |  |
| Depreciation/Amortization Rate | D | 22.10% | 30.49% |  |
Valuation Multiple Outcomes
The outcomes presented in this study are the result of original input data, derived data, and synthesized inputs.
Equational Form |
Observed Value |
Single-stagemultiple g solution |
Two-stage valuationmodel g solution |
|||
| 12/31/2015 | 12/31/2016 | 12/31/2015 | 12/31/2016 | 12/31/2015 | 12/31/2016 | |
|
|
1.56 | 1.76 | -0.38% | 5.61% | -0.99% | 6.10% |
|
|
9.62 | 14.59 | -0.38% | 5.61% | -0.99% | 6.10% |
|
|
18.99 | 32.29 | -0.38% | 5.61% | -0.99% | 6.10% |
|
|
17.95 | 30.34 | -0.38% | 5.61% | -0.99% | 6.10% |
|
|
12.34 | 20.99 | -0.38% | 5.61% | -0.99% | 6.10% |
|
|
3.28 | 3.72 | -0.38% | 5.61% | -0.99% | 6.10% |


