Monsanto
Analyst Listing
The following analysts provide coverage for the subject firm as of May 2016:
| Broker | Analyst | Analyst Email |
| Piper Jaffray | Brett Wong | brett.ws.wong@pjc.com |
| Monness Crespi Hardt | Chris L. Shaw | cshaw@mchny.com |
| BB&T Capital Markets | Christopher J. Kapsch | ckapsch@bbandtcm.com |
| Credit Suisse | Christopher S. Parkinson | christopher.parkinson@credit-suisse.com |
| Atlantic Equities | Colin Isaac | c.isaac@atlantic-equities.com |
| Deutsche Bank Research | David Begleiter | david.begleiter@db.com |
| Susquehanna Financial Group | Don Carson | don.carson@sig.com |
| Wells Fargo Securities | Frank J. Mitsch | frank.mitsch@wellsfargo.com |
| BMO Capital Markets | Joel Jackson | joel.jackson@bmo.com |
| Bernstein Research | Jonas Oxgaard | jonas.oxgaard@bernstein.com |
| Jefferies | Laurence Alexander | lalexander@jefferies.com |
| Stifel Nicolaus | Paul Massoud | pamassoud@stifel.com |
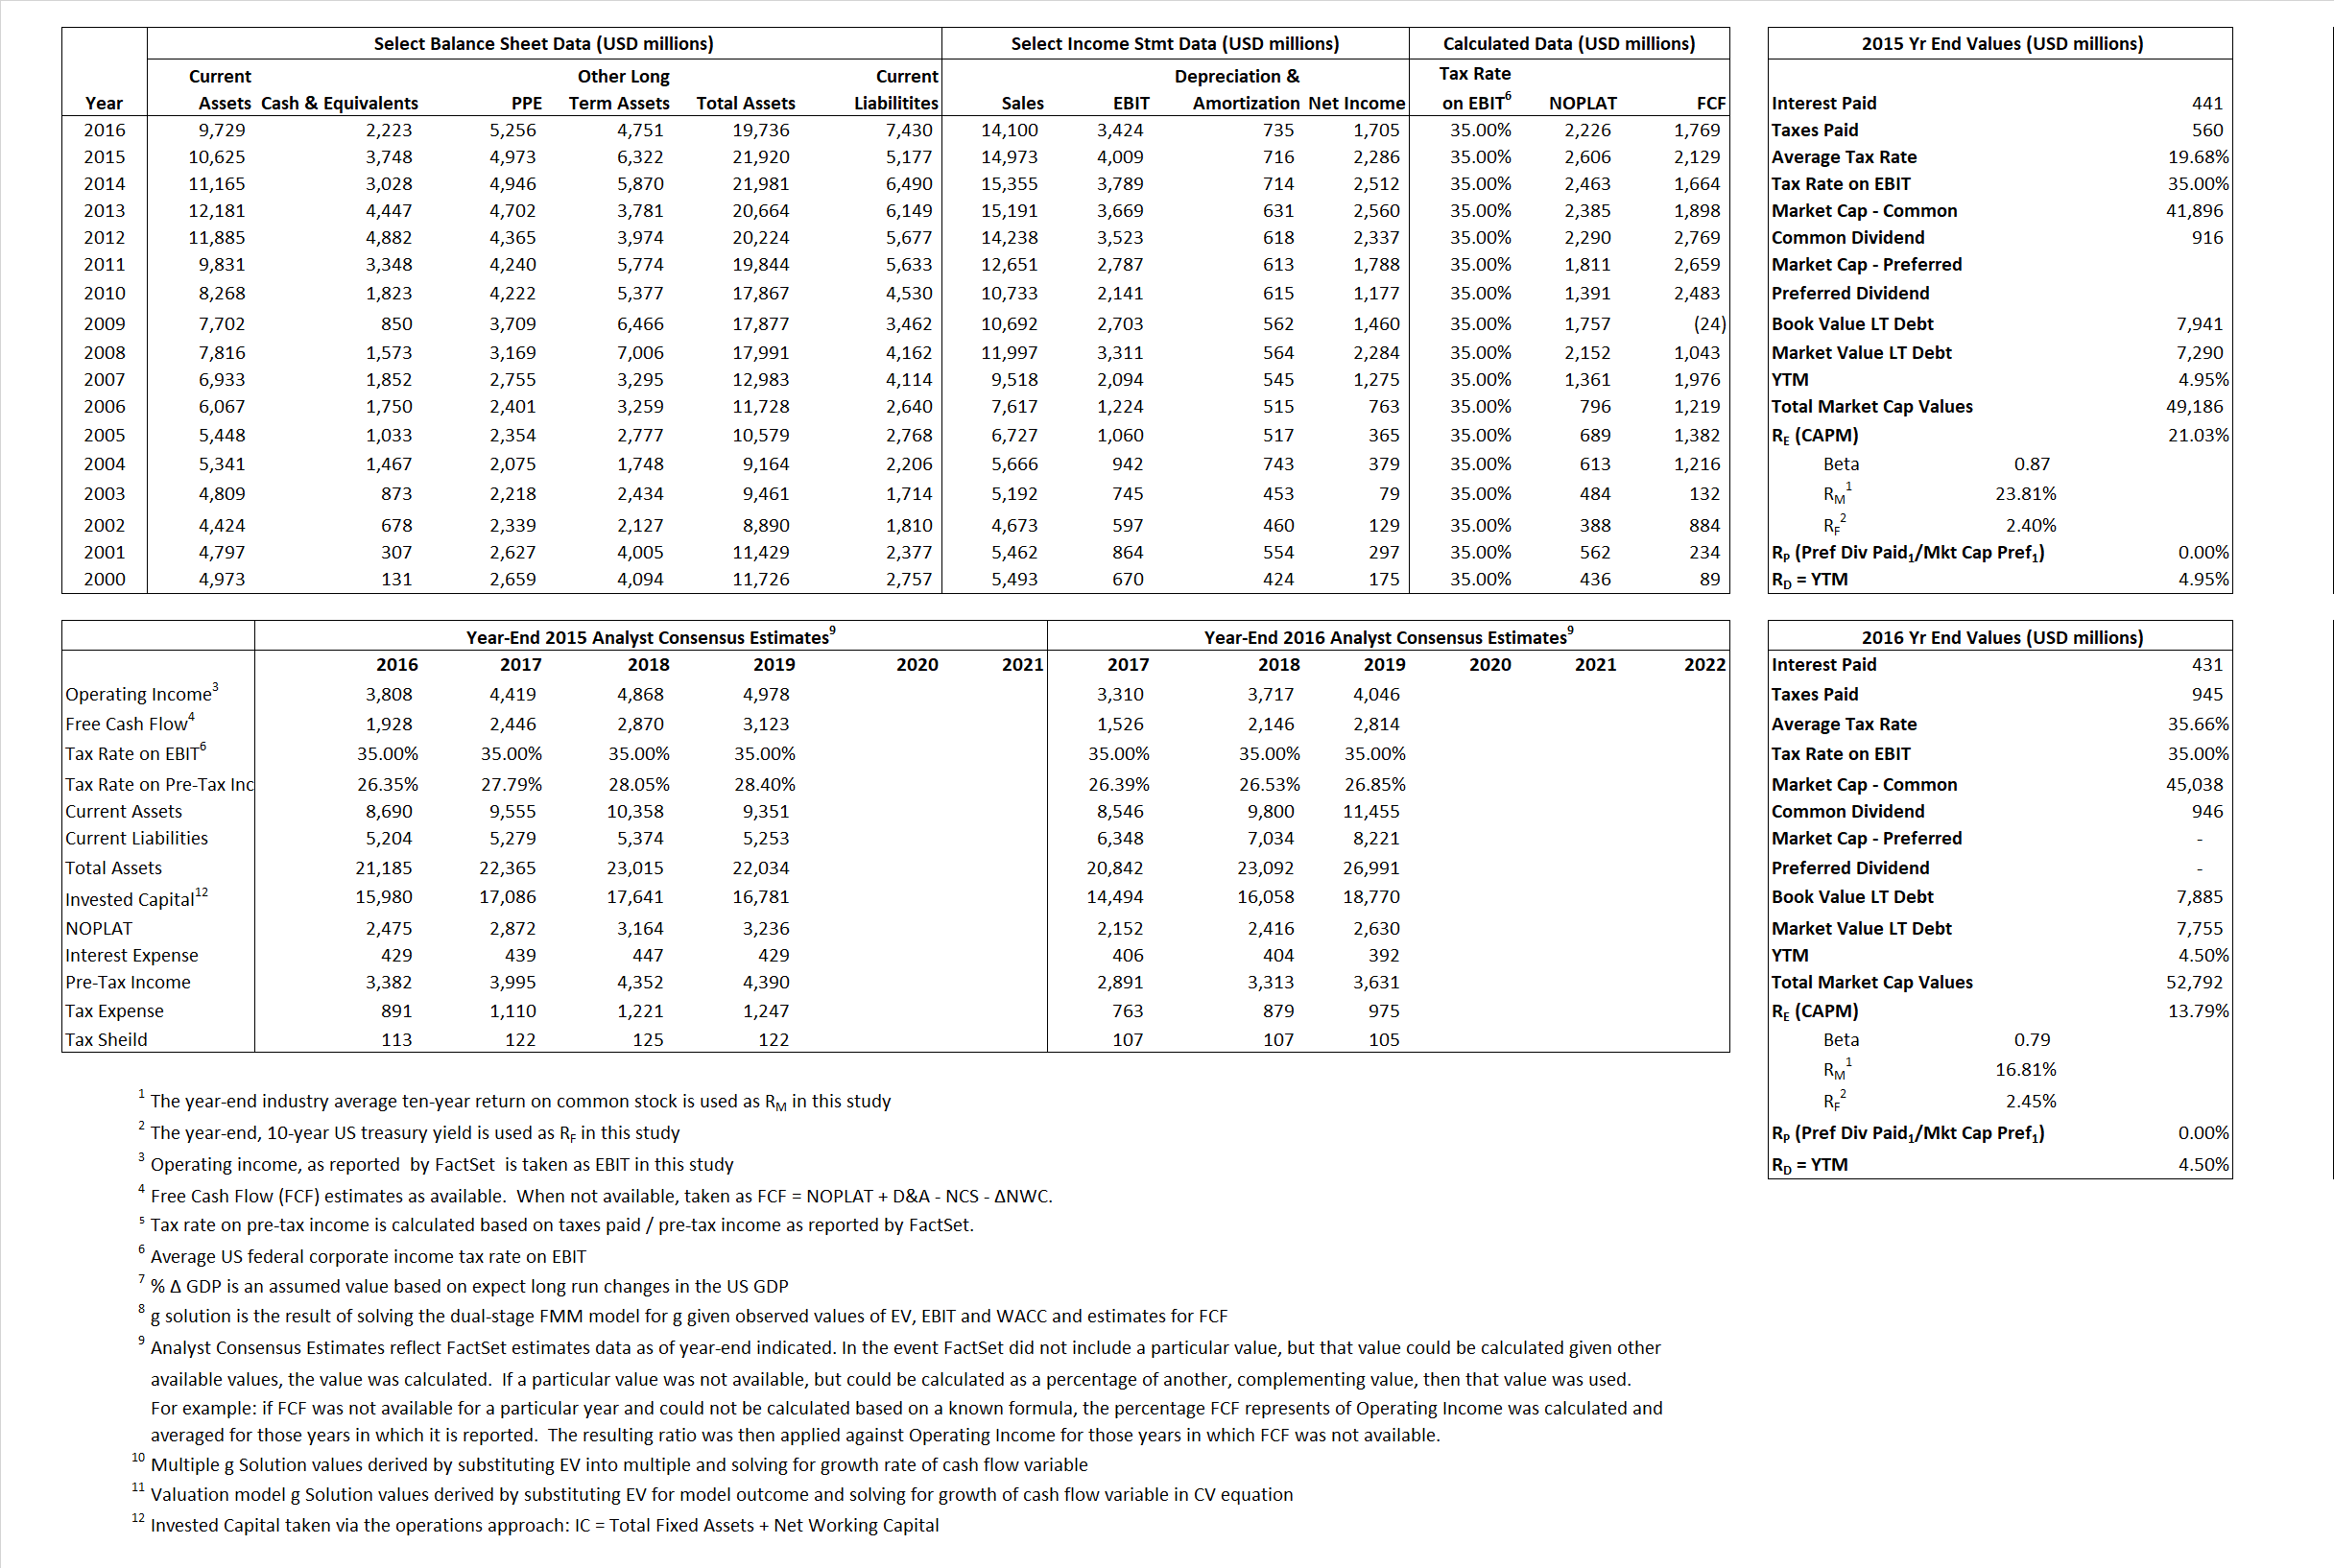
Primary Input Data
Derived Input Data
Derived Input |
Label |
2015 Value |
2016
|
Equational Form |
| Net Operating Profit Less Adjusted Taxes | NOPLAT | 2,606 | 2,226 |  |
| Free Cash Flow | FCF | 2,129 | 1,769 |  |
| Tax Shield | TS | 87 | 154 |  |
| Invested Capital | IC | 16,743 | 12,306 |  |
| Return on Invested Capital | ROIC | 15.56% | 18.09% |  |
| Net Investment | NetInv | 1,968 | (3,702) |  |
| Investment Rate | IR | 75.52% | -166.34% |  |
| Weighted Average Cost of Capital |
WACCMarket | 18.50% | 12.19% |  |
| WACCBook | 6.97% | 6.71% | ||
| Enterprise value |
EVMarket | 45,438 | 50,569 |  |
| EVBook | 47,614 | 50,700 | ||
| Long-Run Growth |
g = IR x ROIC |
11.75% | -30.08% | Long-run growth rates of the income variable are used in the Continuing Value portion of the valuation models. |
g = %  GDP GDP |
2.50% | 2.50% | ||
| Margin from Operations | M | 26.77% | 24.28% |  |
| Depreciation/Amortization Rate | D | 15.15% | 17.67% |  |
Valuation Multiple Outcomes
The outcomes presented in this study are the result of original input data, derived data, and synthesized inputs.
Equational Form |
Observed Value |
Single-stagemultiple g solution |
Two-stage valuationmodel g solution |
|||
| 12/31/2015 | 12/31/2016 | 12/31/2015 | 12/31/2016 | 12/31/2015 | 12/31/2016 | |
|
|
3.03 | 3.59 | 20.21% | 10.30% | 19.32% | 10.97% |
|
|
9.62 | 12.16 | 20.21% | 10.30% | 19.32% | 10.97% |
|
|
17.44 | 22.72 | 20.21% | 10.30% | 19.32% | 10.97% |
|
|
21.35 | 28.59 | 20.21% | 10.30% | 19.32% | 10.97% |
|
|
11.33 | 14.77 | 20.21% | 10.30% | 19.32% | 10.97% |
|
|
2.71 | 4.11 | 20.21% | 10.30% | 19.32% | 10.97% |


