AT&T
Analyst Listing
The following analysts provide coverage for the subject firm as of May 2016:
| Broker | Analyst | Analyst Email |
| Drexel Hamilton | Barry M. Sine | bsine@drexelhamilton.com |
| Cowen & Company | Colby Synesael | colby.synesael@cowen.com |
| FBR Capital Markets & Co | David Dixon | ddixon@fbr.com |
| Raymond James | Frank G. Louthan IV | frank.louthan@raymondjames.com |
| William Blair | James D. Breen | jbreen@williamblair.com |
| DA Davidson | James Moorman | jmoorman@dadco.com |
| Buckingham Research | James Ratcliffe | jratcliffe@buckresearch.com |
| Scotiabank GBM | Jeffrey Fan | jeff.fan@scotiabank.com |
| Nomura Research | Jeffrey Kvaal | jeffrey.kvaal@nomura.com |
| Wells Fargo Securities | Jennifer M. Fritzsche | jennifer.fritzsche@wellsfargo.com |
| RBC Capital Markets | Jonathan Atkin | jonathan.atkin@rbccm.com |
| Evercore ISI | Jonathan Schildkraut | schildkraut@evercoreisi.com |
| Credit Suisse | Joseph Mastrogiovanni | joseph.mastrogiovanni@credit-suisse.com |
| Deutsche Bank Research | Matthew Niknam | matthew.niknam@db.com |
| Pacific Crest Securities-KBCM | Michael G. Bowen | mbowen@pacific-crest.com |
| Jefferies | Mike McCormack | mmccormack@jefferies.com |
| Bernstein Research | Paul de Sa | paul.desa@bernstein.com |
| Oppenheimer | Timothy Horan | tim.horan@opco.com |
| BTIG | Walter Piecyk | wpiecyk@btig.com |
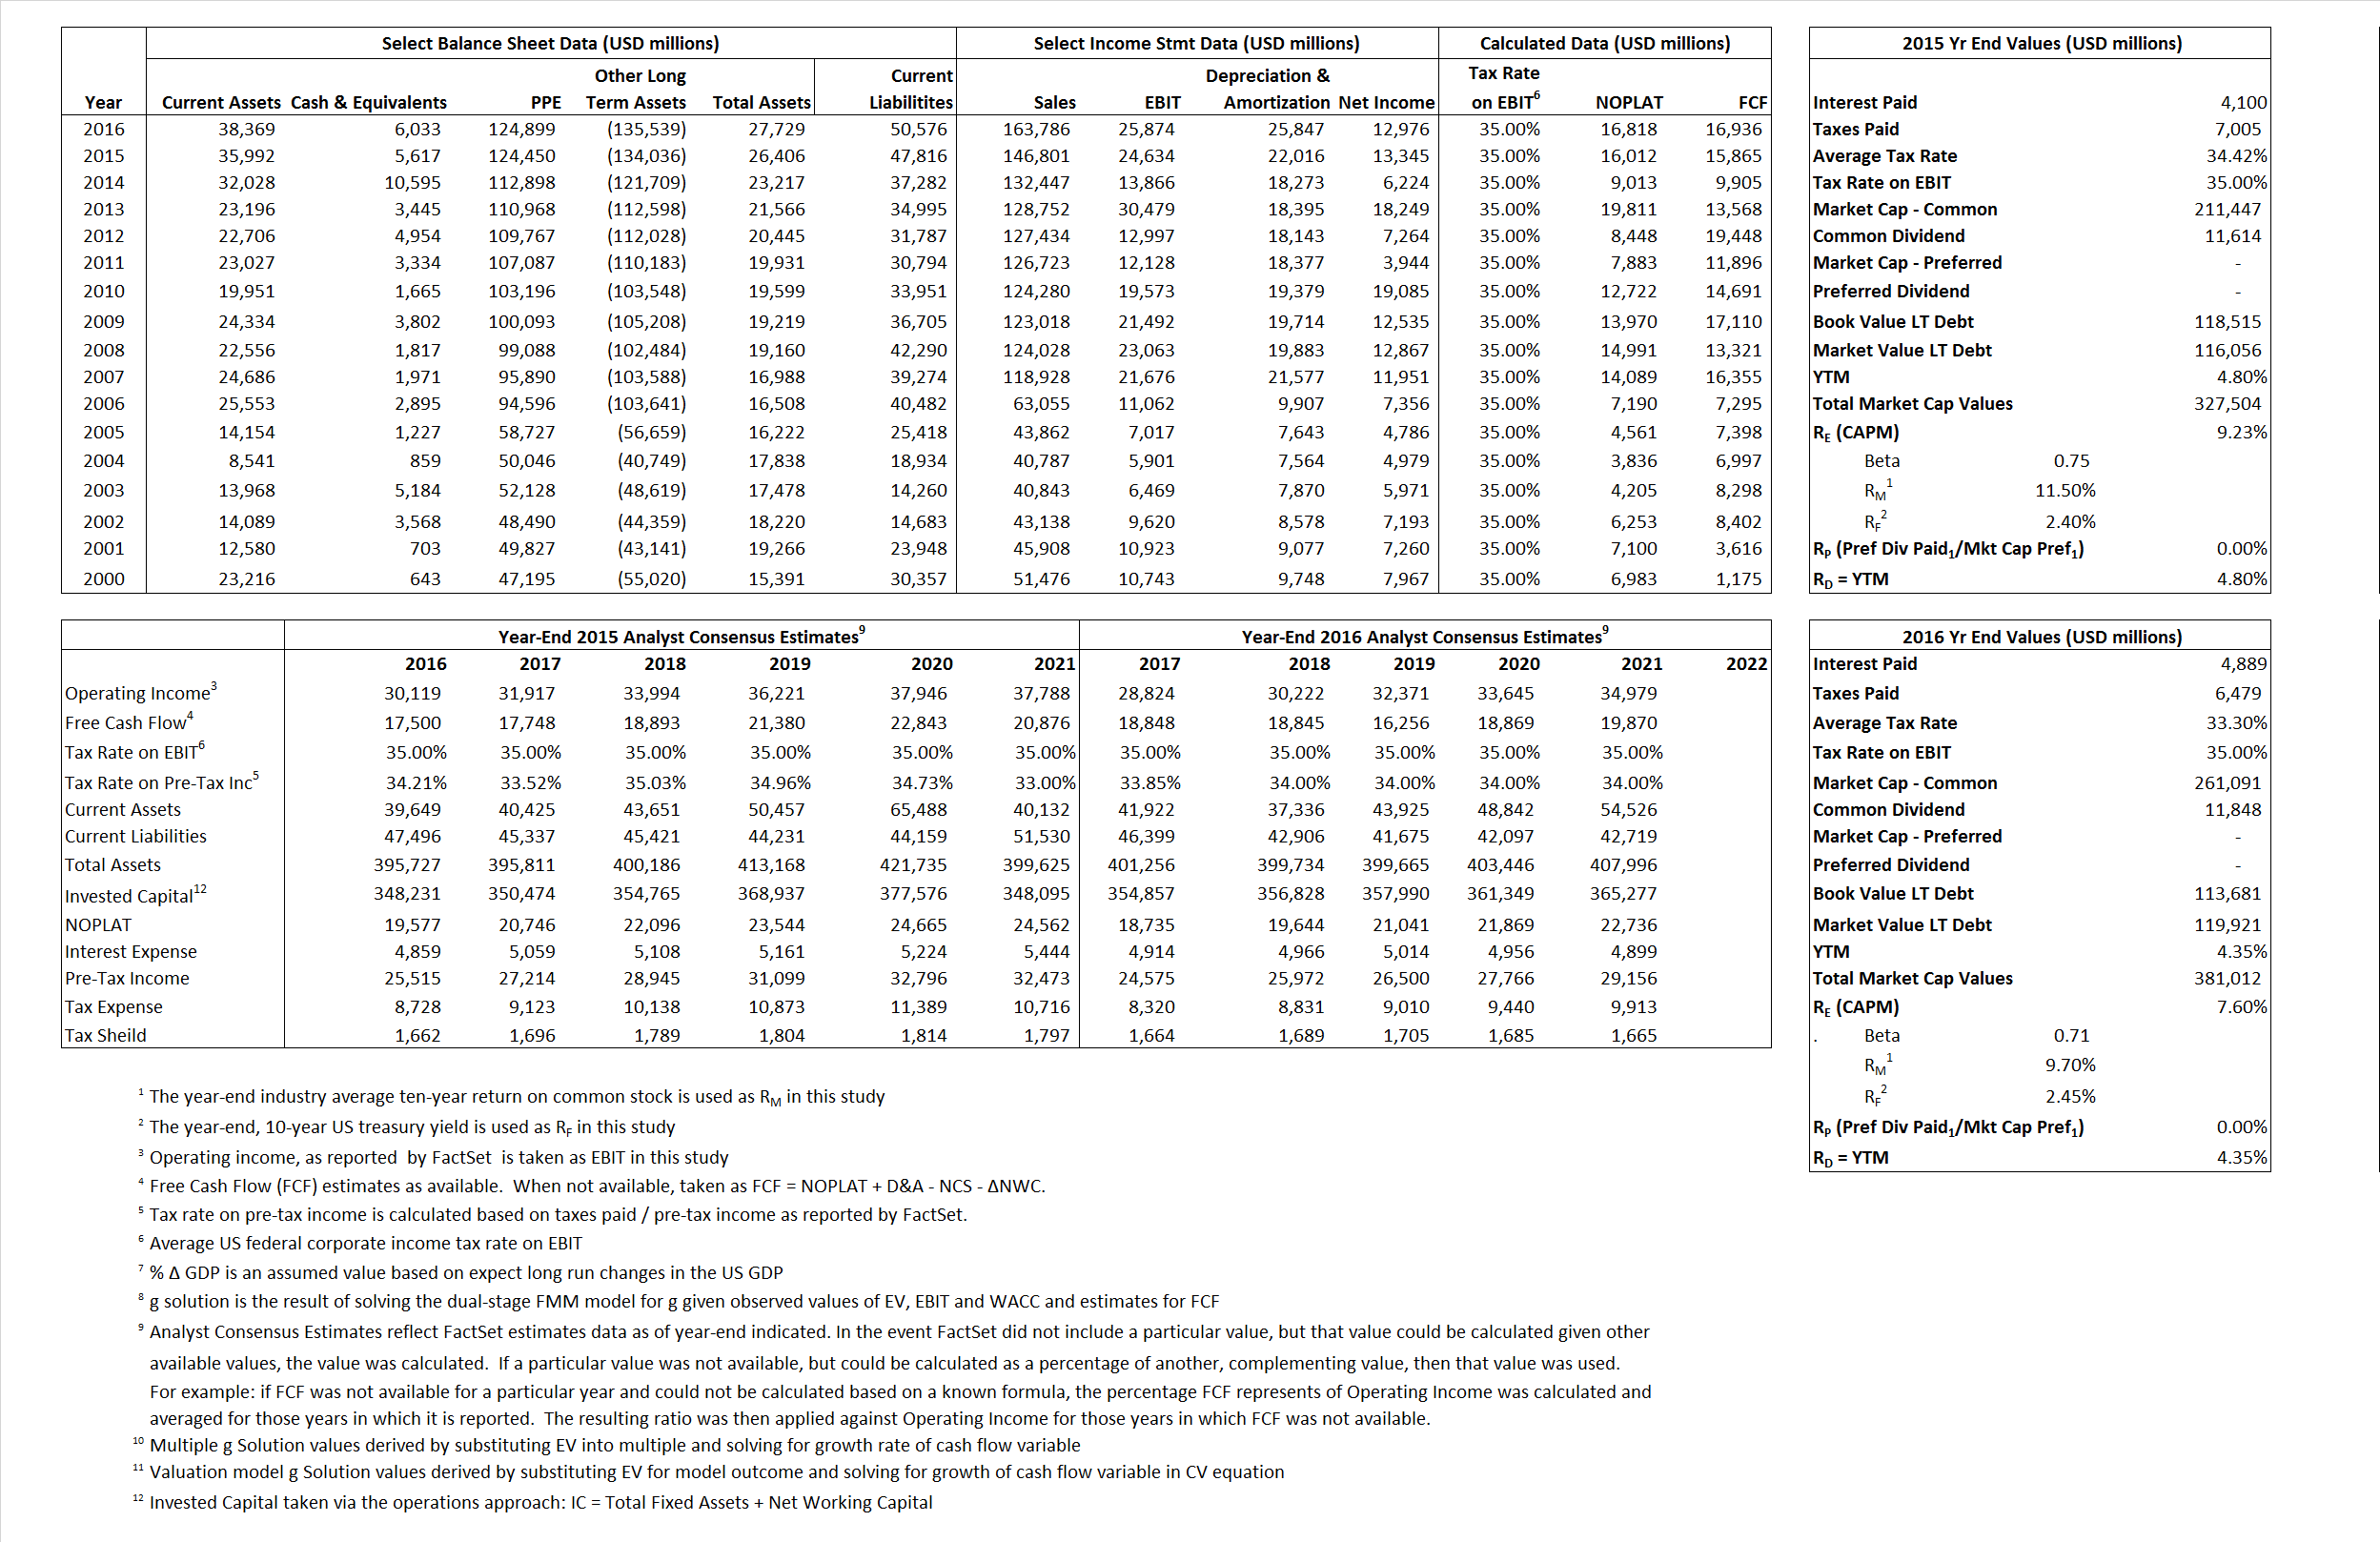
Primary Input Data
Derived Input Data
Derived Input |
Label |
2015 Value |
2016
|
Equational Form |
| Net Operating Profit Less Adjusted Taxes | NOPLAT | 16,012 | 16,818 |  |
| Free Cash Flow | FCF | 15,865 | 16,936 |  |
| Tax Shield | TS | 1,411 | 1,628 |  |
| Invested Capital | IC | (21,410) | (22,847) |  |
| Return on Invested Capital | ROIC | -74.79% | -73.61% |  |
| Net Investment | NetInv | 14,671 | 24,410 |  |
| Investment Rate | IR | 91.62% | 145.14% |  |
| Weighted Average Cost of Capital |
WACCMarket | 7.07% | 6.12% |  |
| WACCBook | 5.53% | 5.52% | ||
| Enterprise value |
EVMarket | 321,887 | 374,979 |  |
| EVBook | 323,929 | 368,739 | ||
| Long-Run Growth |
g = IR x ROIC |
-68.52% | -106.84% | Long-run growth rates of the income variable are used in the Continuing Value portion of the valuation models. |
g = %  GDP GDP |
2.50% | 2.50% | ||
| Margin from Operations | M | 16.78% | 15.80% |  |
| Depreciation/Amortization Rate | D | 47.19% | 49.97% |  |
Valuation Multiple Outcomes
The outcomes presented in this study are the result of original input data, derived data, and synthesized inputs.
Equational Form |
Observed Value |
Single-stagemultiple g solution |
Two-stage valuationmodel g solution |
|||
| 12/31/2015 | 12/31/2016 | 12/31/2015 | 12/31/2016 | 12/31/2015 | 12/31/2016 | |
|
|
2.19 | 2.29 | 1.97% | 1.54% | 2.23% | 2.67% |
|
|
6.90 | 7.25 | 1.97% | 1.54% | 2.23% | 2.67% |
|
|
20.10 | 22.30 | 1.97% | 1.54% | 2.23% | 2.67% |
|
|
20.29 | 22.14 | 1.97% | 1.54% | 2.23% | 2.67% |
|
|
13.07 | 14.49 | 1.97% | 1.54% | 2.23% | 2.67% |
|
|
-15.03 | -16.41 | 1.97% | 1.54% | 2.23% | 2.67% |


