Wal-Mart
Analyst Listing
The following analysts provide coverage for the subject firm as of May 2016:
| Broker | Analyst | Analyst Email |
| Stephens Inc | Ben Bienvenu | ben.bienvenu@stephens.com |
| Raymond James | Budd Bugatch | budd.bugatch@raymondjames.com |
| Northcoast Research | Chuck Cerankosky | chuck.cerankosky@northcoastresearch.com |
| Jefferies | Daniel Binder | dbinder@jefferies.com |
| Consumer Edge Research | David A. Schick | dschick@consumeredgeresearch.com |
| Evercore ISI | Greg Melich | greg.melich@evercoreisi.com |
| Buckingham Research | John Zolidis | jzolidis@buckresearch.com |
| Telsey Advisory Group | Joseph Feldman | jfeldman@telseygroup.com |
| Daiwa Securities Co. Ltd. | Kahori Tamada | kahori.tamada@us.daiwacm.com |
| Credit Suisse | Michael Exstein | michael.exstein@credit-suisse.com |
| Cowen & Company | Oliver Chen | oliver.chen@cowen.com |
| Deutsche Bank Research | Paul Trussell | paul.trussell@db.com |
| CRT Capital Group | Renato Basanta | rbasanta@sterneageecrt.com |
| Nomura Research | Robert S. Drbul | robert.drbul@nomura.com |
| RBC Capital Markets | Scot Ciccarelli | scot.ciccarelli@rbccm.com |
| Wolfe Research | Scott Mushkin | smushkin@wolferesearch.com |
| BMO Capital Markets | Wayne Hood | wayne.hood@bmo.com |
Primary Input Data
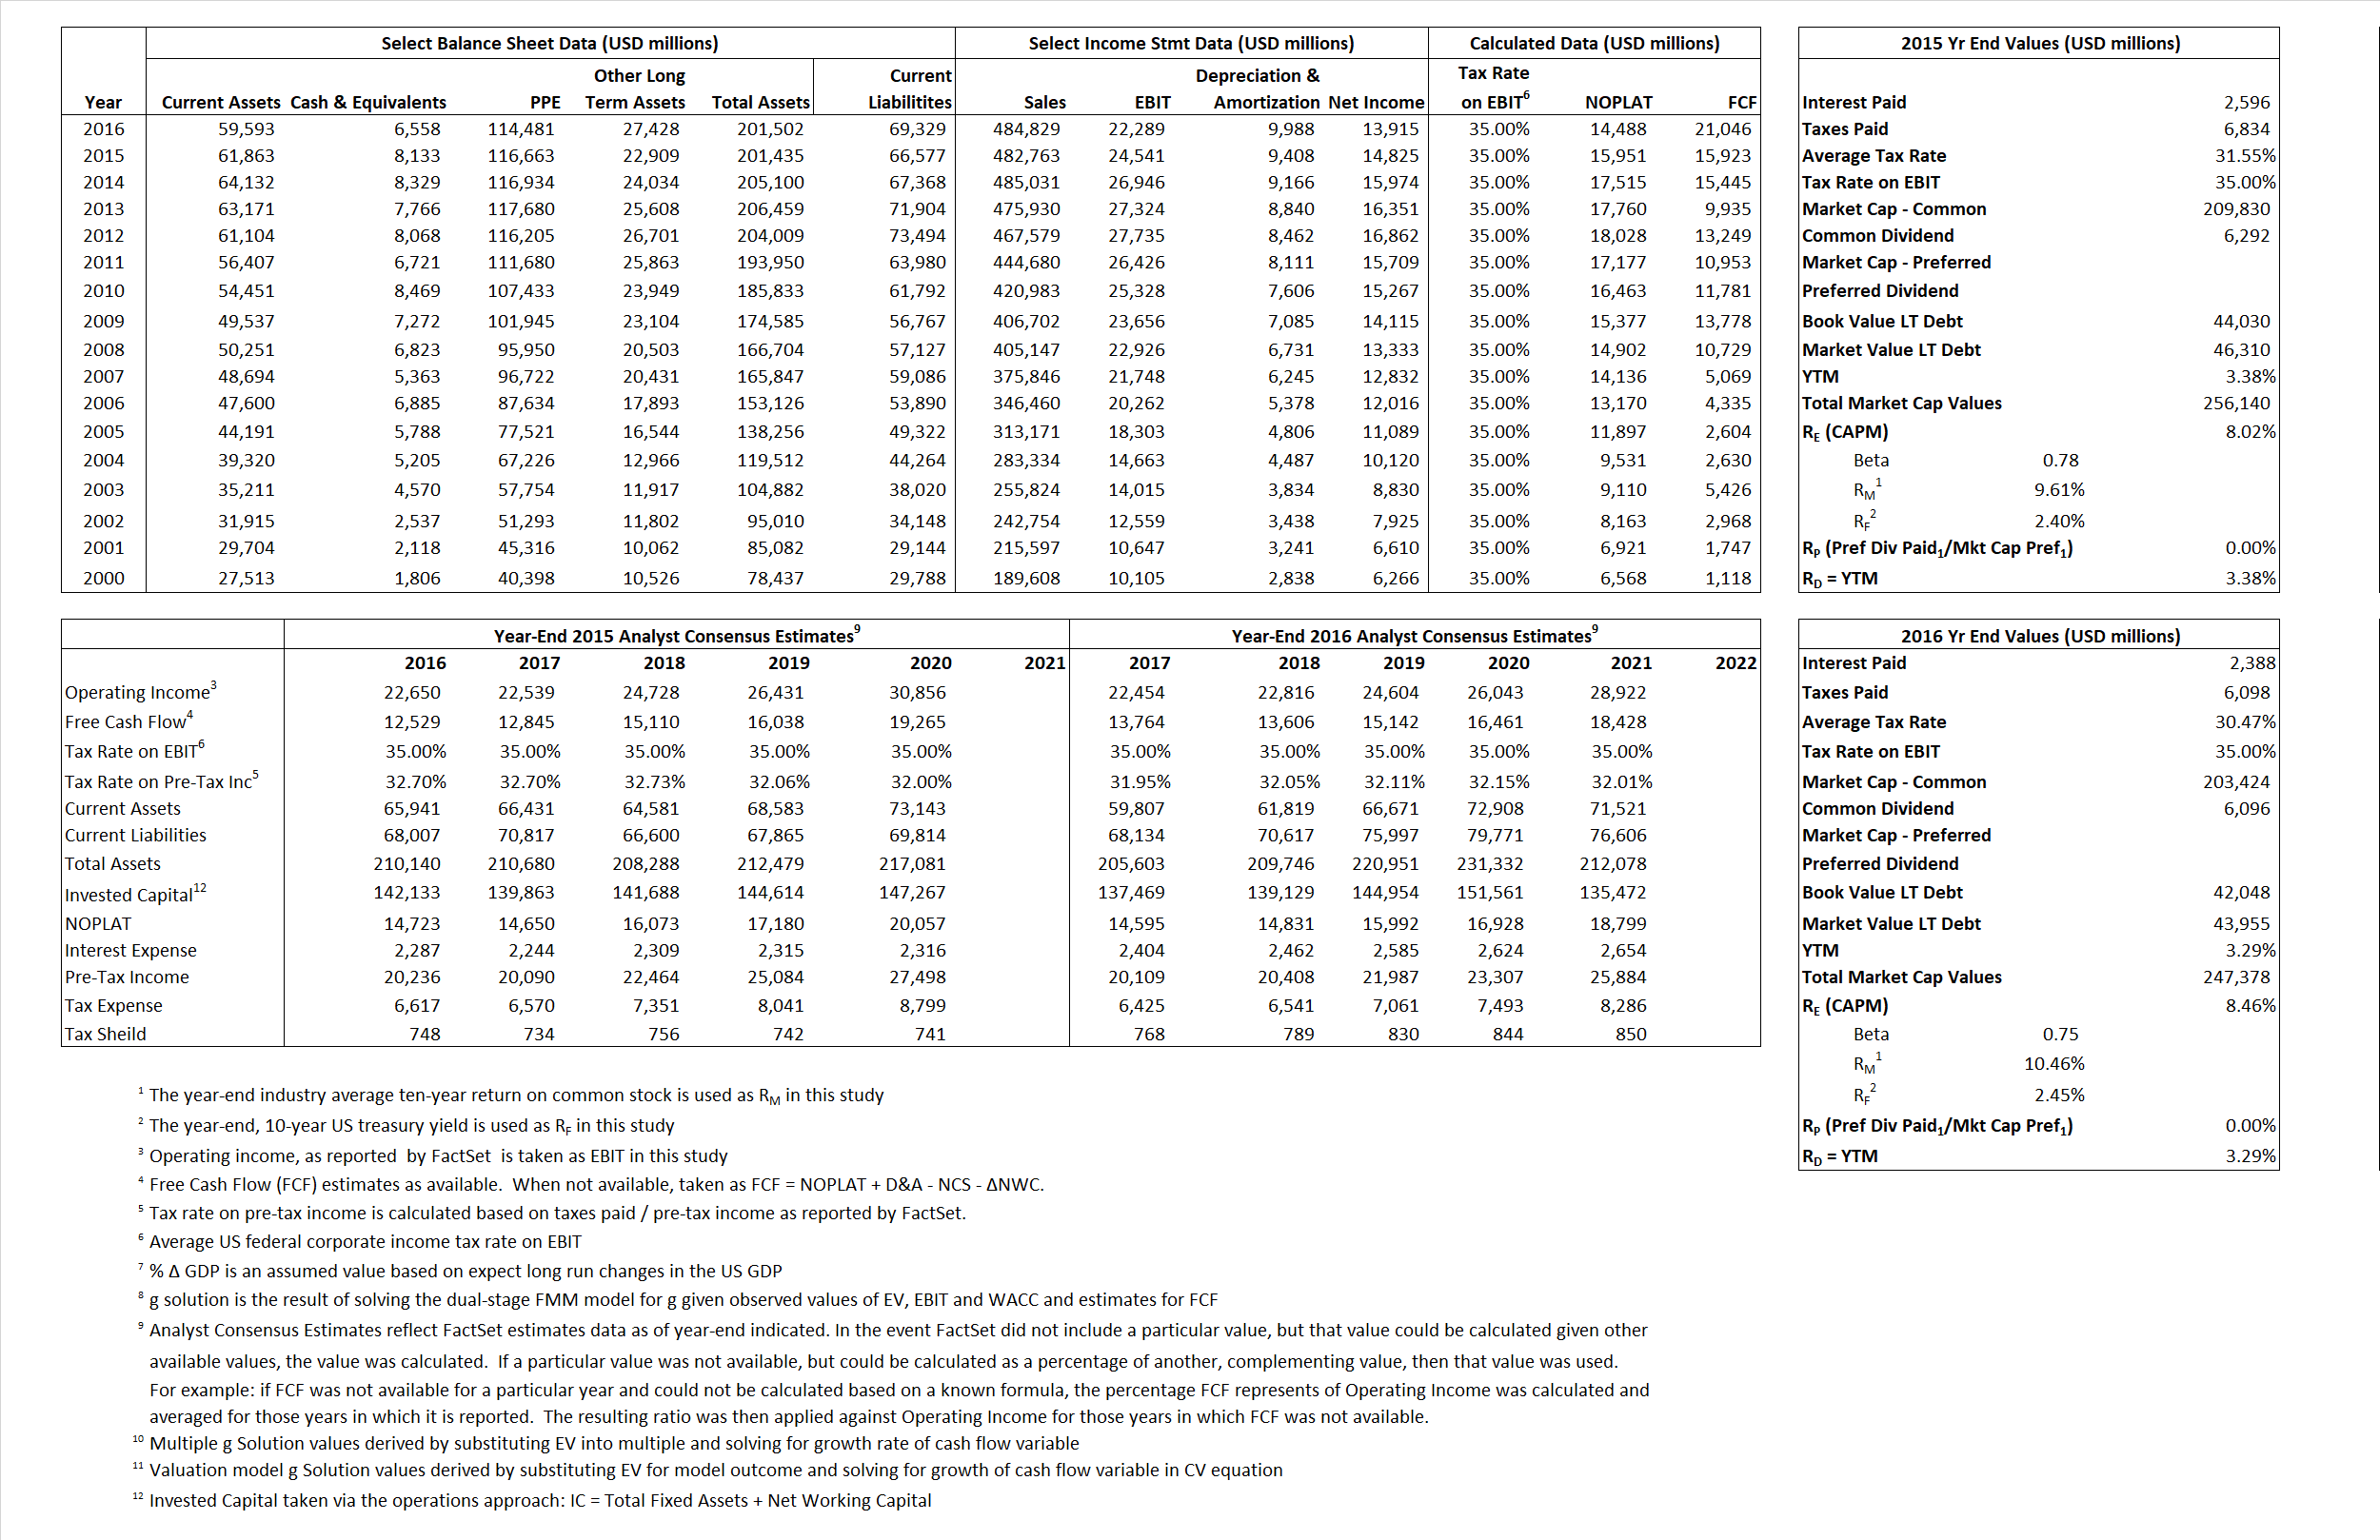
Derived Input Data
Derived Input |
Label |
2015 Value |
2016
|
Equational Form |
| Net Operating Profit Less Adjusted Taxes | NOPLAT | 15,951 | 14,488 |  |
| Free Cash Flow | FCF | 15,923 | 21,046 |  |
| Tax Shield | TS | 819 | 728 |  |
| Invested Capital | IC | 134,859 | 132,174 |  |
| Return on Invested Capital | ROIC | 11.83% | 10.96% |  |
| Net Investment | NetInv | 6,534 | 7,303 |  |
| Investment Rate | IR | 40.96% | 50.41% |  |
| Weighted Average Cost of Capital |
WACCMarket | 6.99% | 7.36% |  |
| WACCBook | 6.39% | 6.14% | ||
| Enterprise value |
EVMarket | 248,007 | 240,821 |  |
| EVBook | 247,302 | 238,914 | ||
| Long-Run Growth |
g = IR x ROIC |
4.85% | 5.53% | Long-run growth rates of the income variable are used in the Continuing Value portion of the valuation models. |
g = %  GDP GDP |
2.50% | 2.50% | ||
| Margin from Operations | M | 5.08% | 4.60% |  |
| Depreciation/Amortization Rate | D | 27.71% | 30.95% |  |
Valuation Multiple Outcomes
The outcomes presented in this study are the result of original input data, derived data, and synthesized inputs.
Equational Form |
Observed Value |
Single-stagemultiple g solution |
Two-stage valuationmodel g solution |
|||
| 12/31/2015 | 12/31/2016 | 12/31/2015 | 12/31/2016 | 12/31/2015 | 12/31/2016 | |
|
|
0.51 | 0.50 | 1.23% | 2.98% | 1.85% | 5.11% |
|
|
7.31 | 7.46 | 1.23% | 2.98% | 1.85% | 5.11% |
|
|
15.55 | 16.62 | 1.23% | 2.98% | 1.85% | 5.11% |
|
|
15.58 | 11.44 | 1.23% | 2.98% | 1.85% | 5.11% |
|
|
10.11 | 10.80 | 1.23% | 2.98% | 1.85% | 5.11% |
|
|
1.84 | 1.82 | 1.23% | 2.98% | 1.85% | 5.11% |


