International Business Machines Corporation
Analyst Listing
The following analysts provide coverage for the subject firm as of May 2016:
| Broker | Analyst | Analyst Email |
| RBC Capital Markets | Amit Daryanani | amit.daryanani@rbccm.com |
| Drexel Hamilton | Brian J. White | bwhite@drexelhamilton.com |
| Stifel Nicolaus | David Grossman | dgrossman@stifel.com |
| JMP Securities | Greg Mcdowell | gmcdowell@jmpsecurities.com |
| Jefferies | James Kisner | jkisner@jefferies.com |
| Atlantic Equities | Josep Bori | j.bori@atlantic-equities.com |
| Cantor Fitzgerald | Joseph D. Foresi | jforesi@cantor.com |
| Daiwa Securities Co. Ltd. | Kazuya Nishimura | kazuya.nishimura@us.daiwacm.com |
| BMO Capital Markets | Keith Bachman | keith.bachman@bmo.com |
| Credit Suisse | Kulbinder Garcha | kulbinder.garcha@credit-suisse.com |
| Wells Fargo Securities | Maynard J. Um | maynard.um@wellsfargo.com |
| Societe Generale | Richard Nguyen | richard.nguyen@sgcib.com |
| Deutsche Bank Research | Sherri Scribner | sherri.scribner@db.com |
| Bernstein Research | Toni M. Sacconaghi Jr | sacconaghi@bernstein.com |
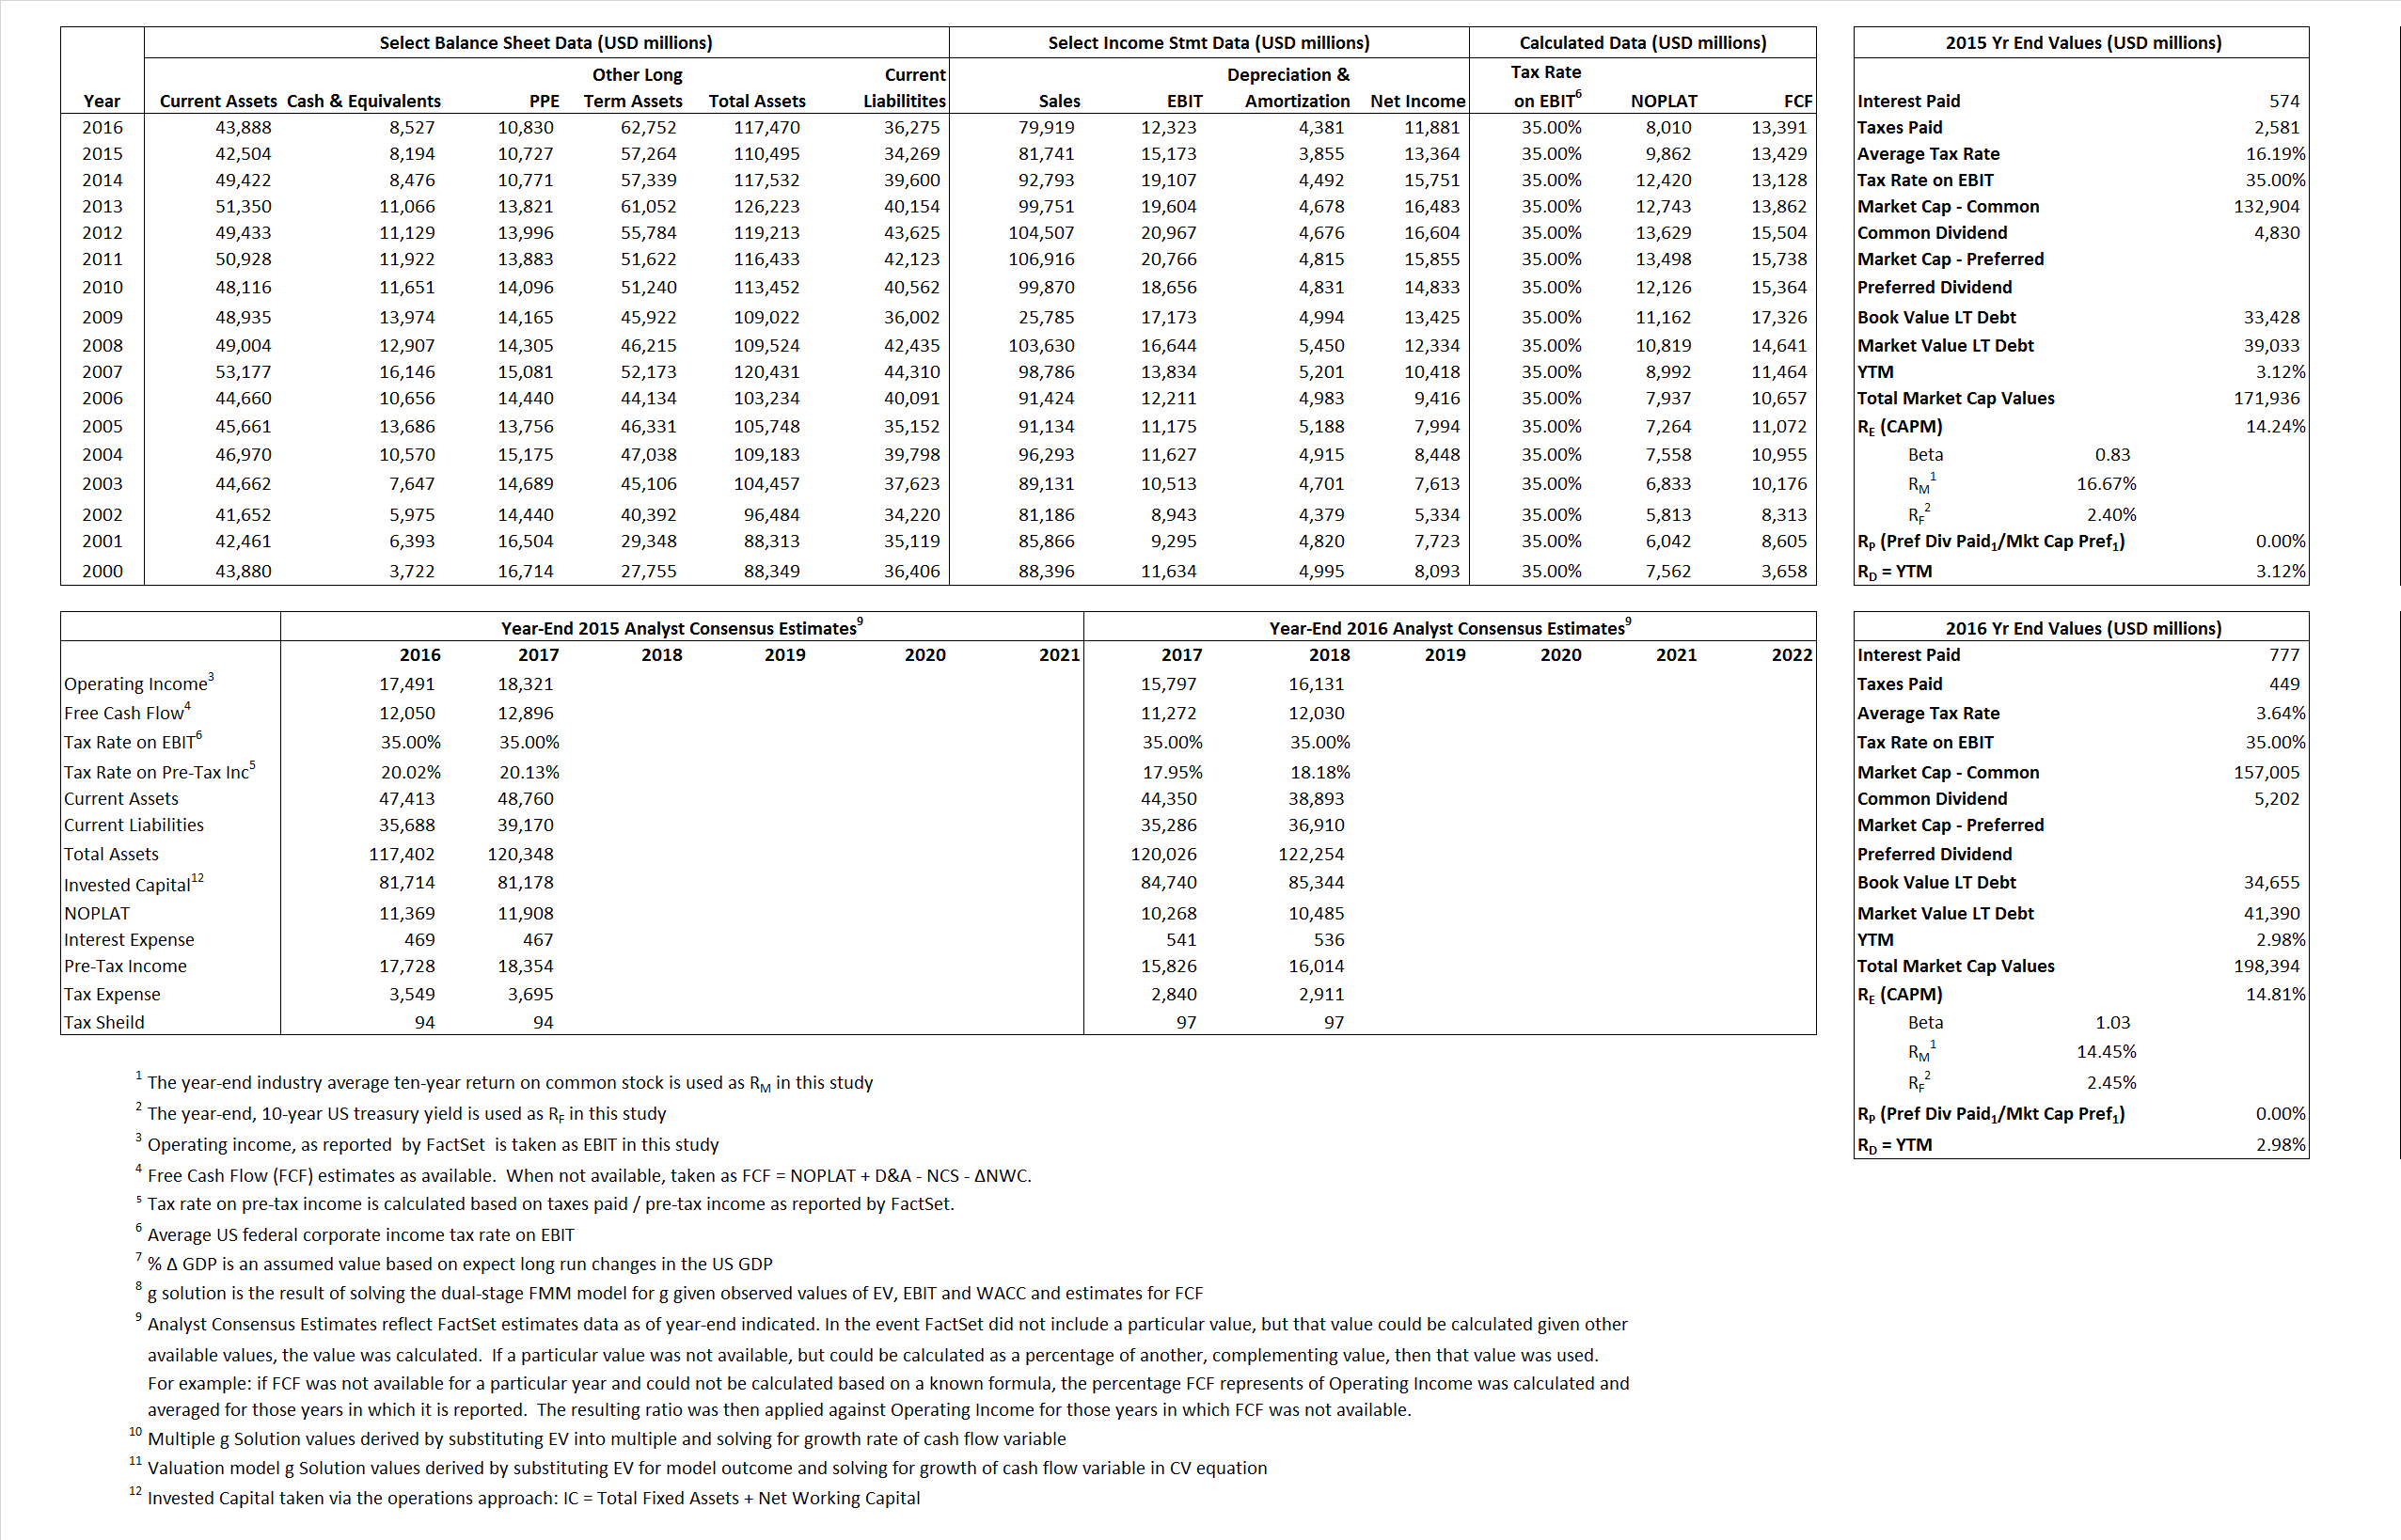
Primary Input Data
Derived Input Data
Derived Input |
Label |
2015 Value |
2016
|
Equational Form |
| Net Operating Profit Less Adjusted Taxes | NOPLAT | 9,862 | 8,010 |  |
| Free Cash Flow | FCF | 13,429 | 13,391 |  |
| Tax Shield | TS | 93 | 28 |  |
| Invested Capital | IC | 76,226 | 81,195 |  |
| Return on Invested Capital | ROIC | 12.94% | 9.87% |  |
| Net Investment | NetInv | 2,149 | 9,350 |  |
| Investment Rate | IR | 21.79% | 116.73% |  |
| Weighted Average Cost of Capital |
WACCMarket | 11.60% | 12.32% |  |
| WACCBook | 6.79% | 7.77% | ||
| Enterprise value |
EVMarket | 163,742 | 189,867 |  |
| EVBook | 158,138 | 183,133 | ||
| Long-Run Growth |
g = IR x ROIC |
2.82% | 11.52% | Long-run growth rates of the income variable are used in the Continuing Value portion of the valuation models. |
g = %  GDP GDP |
2.50% | 2.50% | ||
| Margin from Operations | M | 18.56% | 15.42% |  |
| Depreciation/Amortization Rate | D | 20.26% | 26.23% |  |
Valuation Multiple Outcomes
The outcomes presented in this study are the result of original input data, derived data, and synthesized inputs.
Equational Form |
Observed Value |
Single-stagemultiple g solution |
Two-stage valuationmodel g solution |
|||
| 12/31/2015 | 12/31/2016 | 12/31/2015 | 12/31/2016 | 12/31/2015 | 12/31/2016 | |
|
|
2.00 | 2.38 | 10.44% | 14.15% | 10.60% | 13.58% |
|
|
8.61 | 11.37 | 10.44% | 14.15% | 10.60% | 13.58% |
|
|
16.60 | 23.70 | 10.44% | 14.15% | 10.60% | 13.58% |
|
|
12.19 | 14.18 | 10.44% | 14.15% | 10.60% | 13.58% |
|
|
10.79 | 15.41 | 10.44% | 14.15% | 10.60% | 13.58% |
|
|
2.15 | 2.34 | 10.44% | 14.15% | 10.60% | 13.58% |


