Exxon Mobil Corporation
Analyst Listing
The following analysts provide coverage for the subject firm as of May 2016:
| Broker | Analyst | Analyst Email |
| Tudor Pickering Holt & Co. | Anish Kapadia | akapadia@tudorpickering.com |
| Scotia Howard Weil | Blake Fernandez | blake.fernandez@scotiabank.com |
| Evercore ISI | Douglas Terreson | doug.terreson@evercoreisi.com |
| Credit Suisse | Edward Westlake | edward.westlake@credit-suisse.com |
| Piper Jaffray | Guy Baber | guy.a.baber@simmonspjc.com |
| Wolfe Research | Paul Sankey | psankey@wolferesearch.com |
| Raymond James | Pavel Molchanov | pavel.molchanov@raymondjames.com |
| Wells Fargo Securities | Roger D. Read | roger.read@wellsfargo.com |
| Cowen & Company | Sam Margolin | sam.margolin@cowen.com |
Primary Input Data
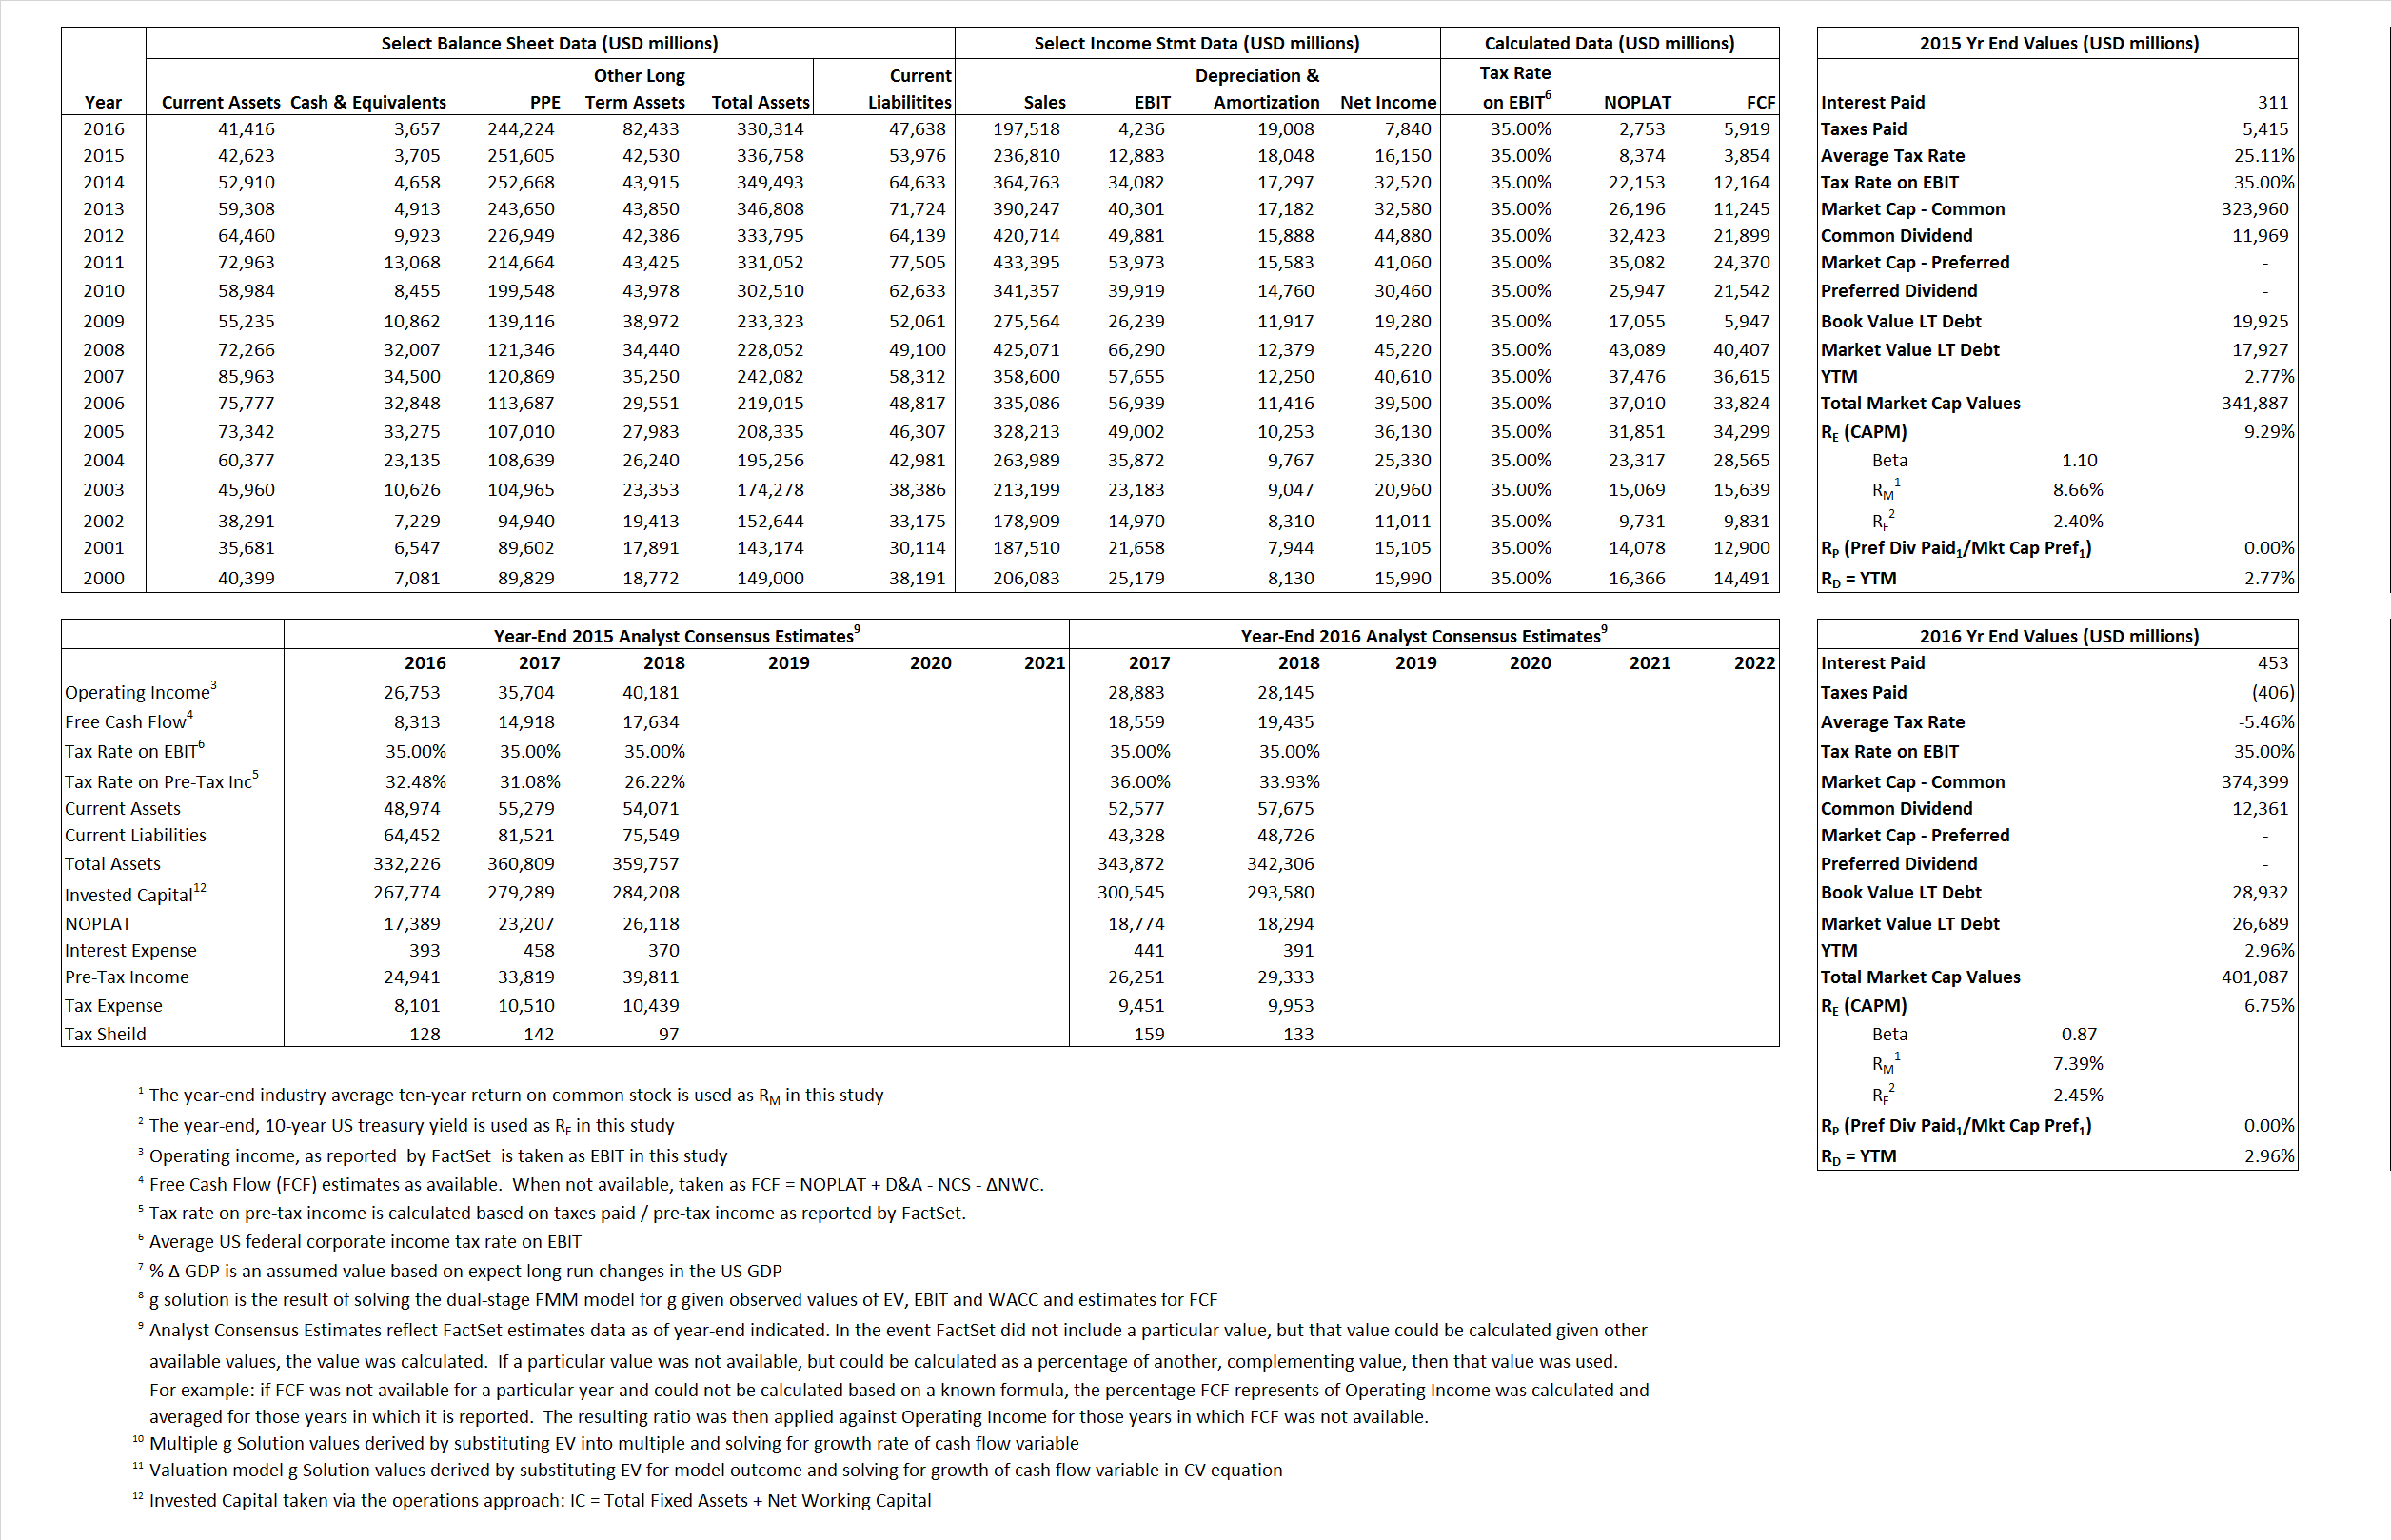
Derived Input Data
Derived Input |
Label |
2015 Value |
2016
|
Equational Form |
| Net Operating Profit Less Adjusted Taxes | NOPLAT | 8,374 | 2,759 |  |
| Free Cash Flow | FCF | 3,854 | 5,919 |  |
| Tax Shield | TS | 78 | (25) |  |
| Invested Capital | IC | 282,782 | 320,435 |  |
| Return on Invested Capital | ROIC | 2.96% | 0.86% |  |
| Net Investment | NetInv | 15,970 | 56,661 |  |
| Investment Rate | IR | 190.71% | 2,057.86% |  |
| Weighted Average Cost of Capital |
WACCMarket | 8.91% | 6.51% |  |
| WACCBook | 9.19% | 7.50% | ||
| Enterprise value |
EVMarket | 338,182 | 397,430 |  |
| EVBook | 340,228 | 399,674 | ||
| Long-Run Growth |
g = IR x ROIC |
5.65% | 17.68% | Long-run growth rates of the income variable are used in the Continuing Value portion of the valuation models. |
g = %  GDP GDP |
2.50% | 2.50% | ||
| Margin from Operations | M | 5.44% | 2.14% |  |
| Depreciation/Amortization Rate | D | 58.35% | 81.78% |  |
Valuation Multiple Outcomes
The outcomes presented in this study are the result of original input data, derived data, and synthesized inputs.
Equational Form |
Observed Value |
Single-stagemultiple g solution |
Two-stage valuationmodel g solution |
|||
| 12/31/2015 | 12/31/2016 | 12/31/2015 | 12/31/2016 | 12/31/2015 | 12/31/2016 | |
|
|
1.43 | 2.01 | 39.26% | 30.01% | 24.15% | 20.38% |
|
|
10.93 | 17.10 | 39.26% | 30.01% | 24.15% | 20.38% |
|
|
40.38 | 144.34 | 39.26% | 30.01% | 24.15% | 20.38% |
|
|
87.75 | 67.14 | 39.26% | 30.01% | 24.15% | 20.38% |
|
|
26.25 | 93.82 | 39.26% | 30.01% | 24.15% | 20.38% |
|
|
1.20 | 1.24 | 39.26% | 30.01% | 24.15% | 20.38% |


