Twenty-First Century Fox Inc
Analyst Listing
The following analysts provide coverage for the subject firm as of May 2016:
| Broker | Analyst | Analyst Email |
| Pacific Crest Securities-KBCM | Andy Hargreaves | ahargreaves@pacific-crest.com |
| Nomura Research | Anthony DiClemente | anthony.diclemente@nomura.com |
| FBR Capital Markets & Co | Barton Crockett | bcrockett@fbr.com |
| Stifel Nicolaus | Benjamin E. Mogil | bmogil@stifel.com |
| Pivotal Research Group | Brian Wieser | brian@pvtl.com |
| Deutsche Bank Research | Bryan Kraft | bryan.kraft@db.com |
| BMO Capital Markets | Daniel Salmon | dan.salmon@bmo.com |
| Topeka Capital Markets | David W. Miller | teagan@telseygroup.com |
| Cowen & Company | Doug Creutz | doug.creutz@cowen.com |
| Atlantic Equities | Hamiton Faber | h.faber@atlantic-equities.com |
| Wedbush Securities | James Dix | james.dix@wedbush.com |
| JBL Advisors | Jeffrey B. Logsdon | jeff@jbladvisors.com |
| Jefferies | John Janedis | jjanedis@jefferies.com |
| Needham | Laura Martin | lmartin@needhamco.com |
| Wells Fargo Securities | Marci Ryvicker | marci.ryvicker@wellsfargo.com |
| Guggenheim Securities | Michael C. Morris | michael.morris@guggenheimpartners.com |
| Credit Suisse | Omar Sheikh | omar.sheikh@credit-suisse.com |
| BTIG | Richard Greenfield | rgreenfield@btig.com |
| RBC Capital Markets | Steven Cahall | steven.cahall@rbccm.com |
| Bernstein Research | Todd Juenger | todd.juenger@bernstein.com |
| Telsey Advisory Group | Tom Eagan | teagan@telseygroup.com |
| Evercore ISI | Vijay Jayant | vijay.jayant@evercoreisi.com |
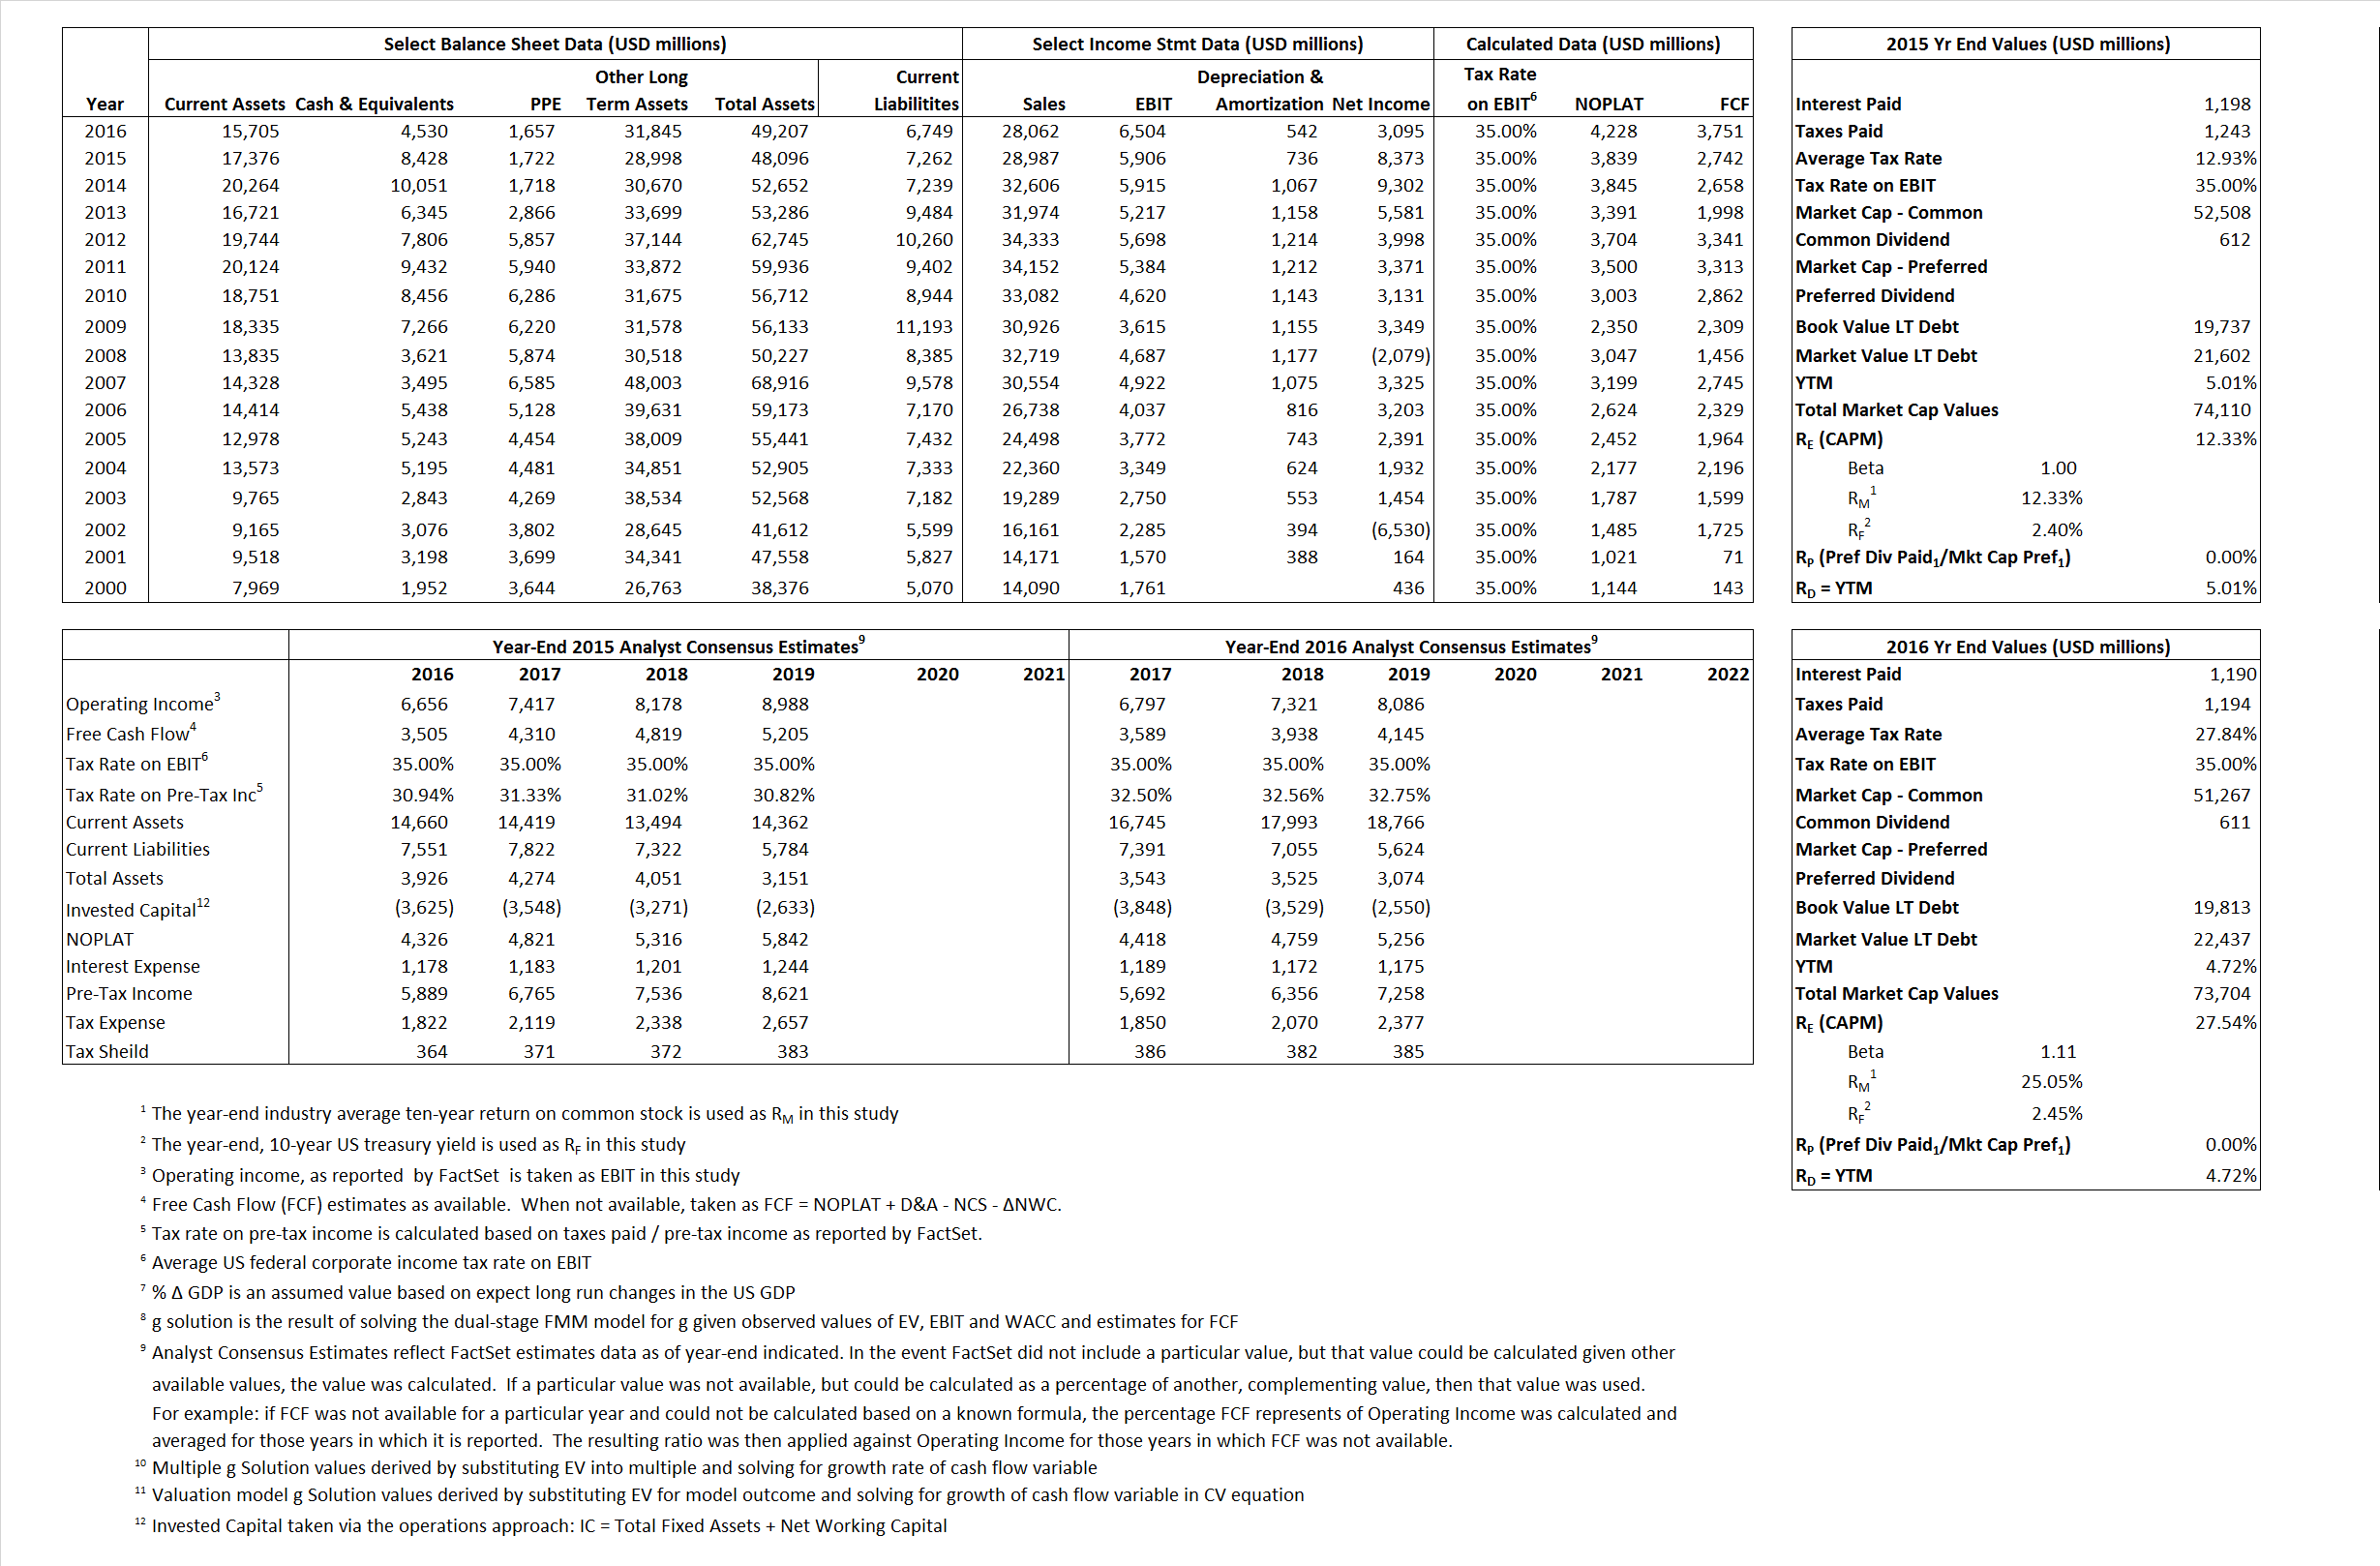
Primary Input Data
Derived Input Data
Derived Input |
Label |
2015 Value |
2016
|
Equational Form |
| Net Operating Profit Less Adjusted Taxes | NOPLAT | 3,839 | 4,228 |  |
| Free Cash Flow | FCF | 2,742 | 3,751 |  |
| Tax Shield | TS | 155 | 331 |  |
| Invested Capital | IC | 40,834 | 42,458 |  |
| Return on Invested Capital | ROIC | 9.40% | 9.96% |  |
| Net Investment | NetInv | (3,843) | 2,166 |  |
| Investment Rate | IR | -100.11% | 51.23% |  |
| Weighted Average Cost of Capital |
WACCMarket | 10.01% | 20.19% |  |
| WACCBook | 7.70% | 7.51% | ||
| Enterprise value |
EVMarket | 65,682 | 69,174 |  |
| EVBook | 63,817 | 66,550 | ||
| Long-Run Growth |
g = IR x ROIC |
-9.41% | 5.10% | Long-run growth rates of the income variable are used in the Continuing Value portion of the valuation models. |
g = %  GDP GDP |
2.50% | 2.50% | ||
| Margin from Operations | M | 20.37% | 23.18% |  |
| Depreciation/Amortization Rate | D | 11.08% | 7.69% |  |
Valuation Multiple Outcomes
The outcomes presented in this study are the result of original input data, derived data, and synthesized inputs.
Equational Form |
Observed Value |
Single-stagemultiple g solution |
Two-stage valuationmodel g solution |
|||
| 12/31/2015 | 12/31/2016 | 12/31/2015 | 12/31/2016 | 12/31/2015 | 12/31/2016 | |
|
|
2,27 | 2.47 | 11.00% | 36.45% | 10.72% | 25.79% |
|
|
9.89 | 9.82 | 11.00% | 36.45% | 10.72% | 25.79% |
|
|
17.11 | 16.36 | 11.00% | 36.45% | 10.72% | 25.79% |
|
|
23.95 | 18.44 | 11.00% | 36.45% | 10.72% | 25.79% |
|
|
11.12 | 10.64 | 11.00% | 36.45% | 10.72% | 25.79% |
|
|
1.61 | 1.63 | 11.00% | 36.45% | 10.72% | 25.79% |


