Cisco Systems, Inc.
Analyst Listing
The following analysts provide coverage for the subject firm as of May 2016:
| Broker | Analyst | Analyst Email |
| Needham | Alex Henderson | ahenderson@needhamco.com |
| CRT Capital Group | Alex Kurtz | akurtz@sterneageecrt.com |
| Pacific Crest Securities-KBCM | Brent Bracelin | bbracelin@pacific-crest.com |
| Drexel Hamilton | Brian J. White | bwhite@drexelhamilton.com |
| JMP Securities | Erik Suppiger | esuppiger@jmpsecurities.com |
| Jefferies | George C. Notter | gnotter@jefferies.com |
| Oppenheimer | Ittai Kidron | ittai.kidron@opco.com |
| William Blair | Jason Ader | jader@williamblair.com |
| Nomura Research | Jeffrey Kvaal | jeffrey.kvaal@nomura.com |
| Wells Fargo Securities | Jess Lubert | jess.lubert@wellsfargo.com |
| Atlantic Equities | Josep Bori | j.bori@atlantic-equities.com |
| Credit Suisse | Kulbinder Garcha | kulbinder.garcha@credit-suisse.com |
| Wunderlich Securities | Matthew Robison | mrobison@wundernet.com |
| RBC Capital Markets | Mitch Steves | mitch.steves@rbccm.com |
| Cowen & Company | Paul Silverstein | paul.silverstein@cowen.com |
| Bernstein Research | Pierre Ferragu | pierre.ferragu@bernstein.com |
| Buckingham Research | Rohit Chopra | rchopra@buckresearch.com |
| Guggenheim Securities | Ryan Hutchinson | ryan.hutchinson@guggenheimpartners.com |
| FBN Securities | Shebly Seyrafi | sseyrafi@fbnsecurities.com |
| Raymond James | Simon Leopold | simon.leopold@raymondjames.com |
| BMO Capital Markets | Tim Long | tim.long@bmo.com |
| Piper Jaffray | Troy D. Jensen | troy.d.jensen@pjc.com |
| Deutsche Bank Research | Vijay Bhagavath | vijay.bhagavath@db.com |
| Daiwa Securities Co. Ltd. | Yoko Yamada | yoko.yamada@us.daiwacm.com |
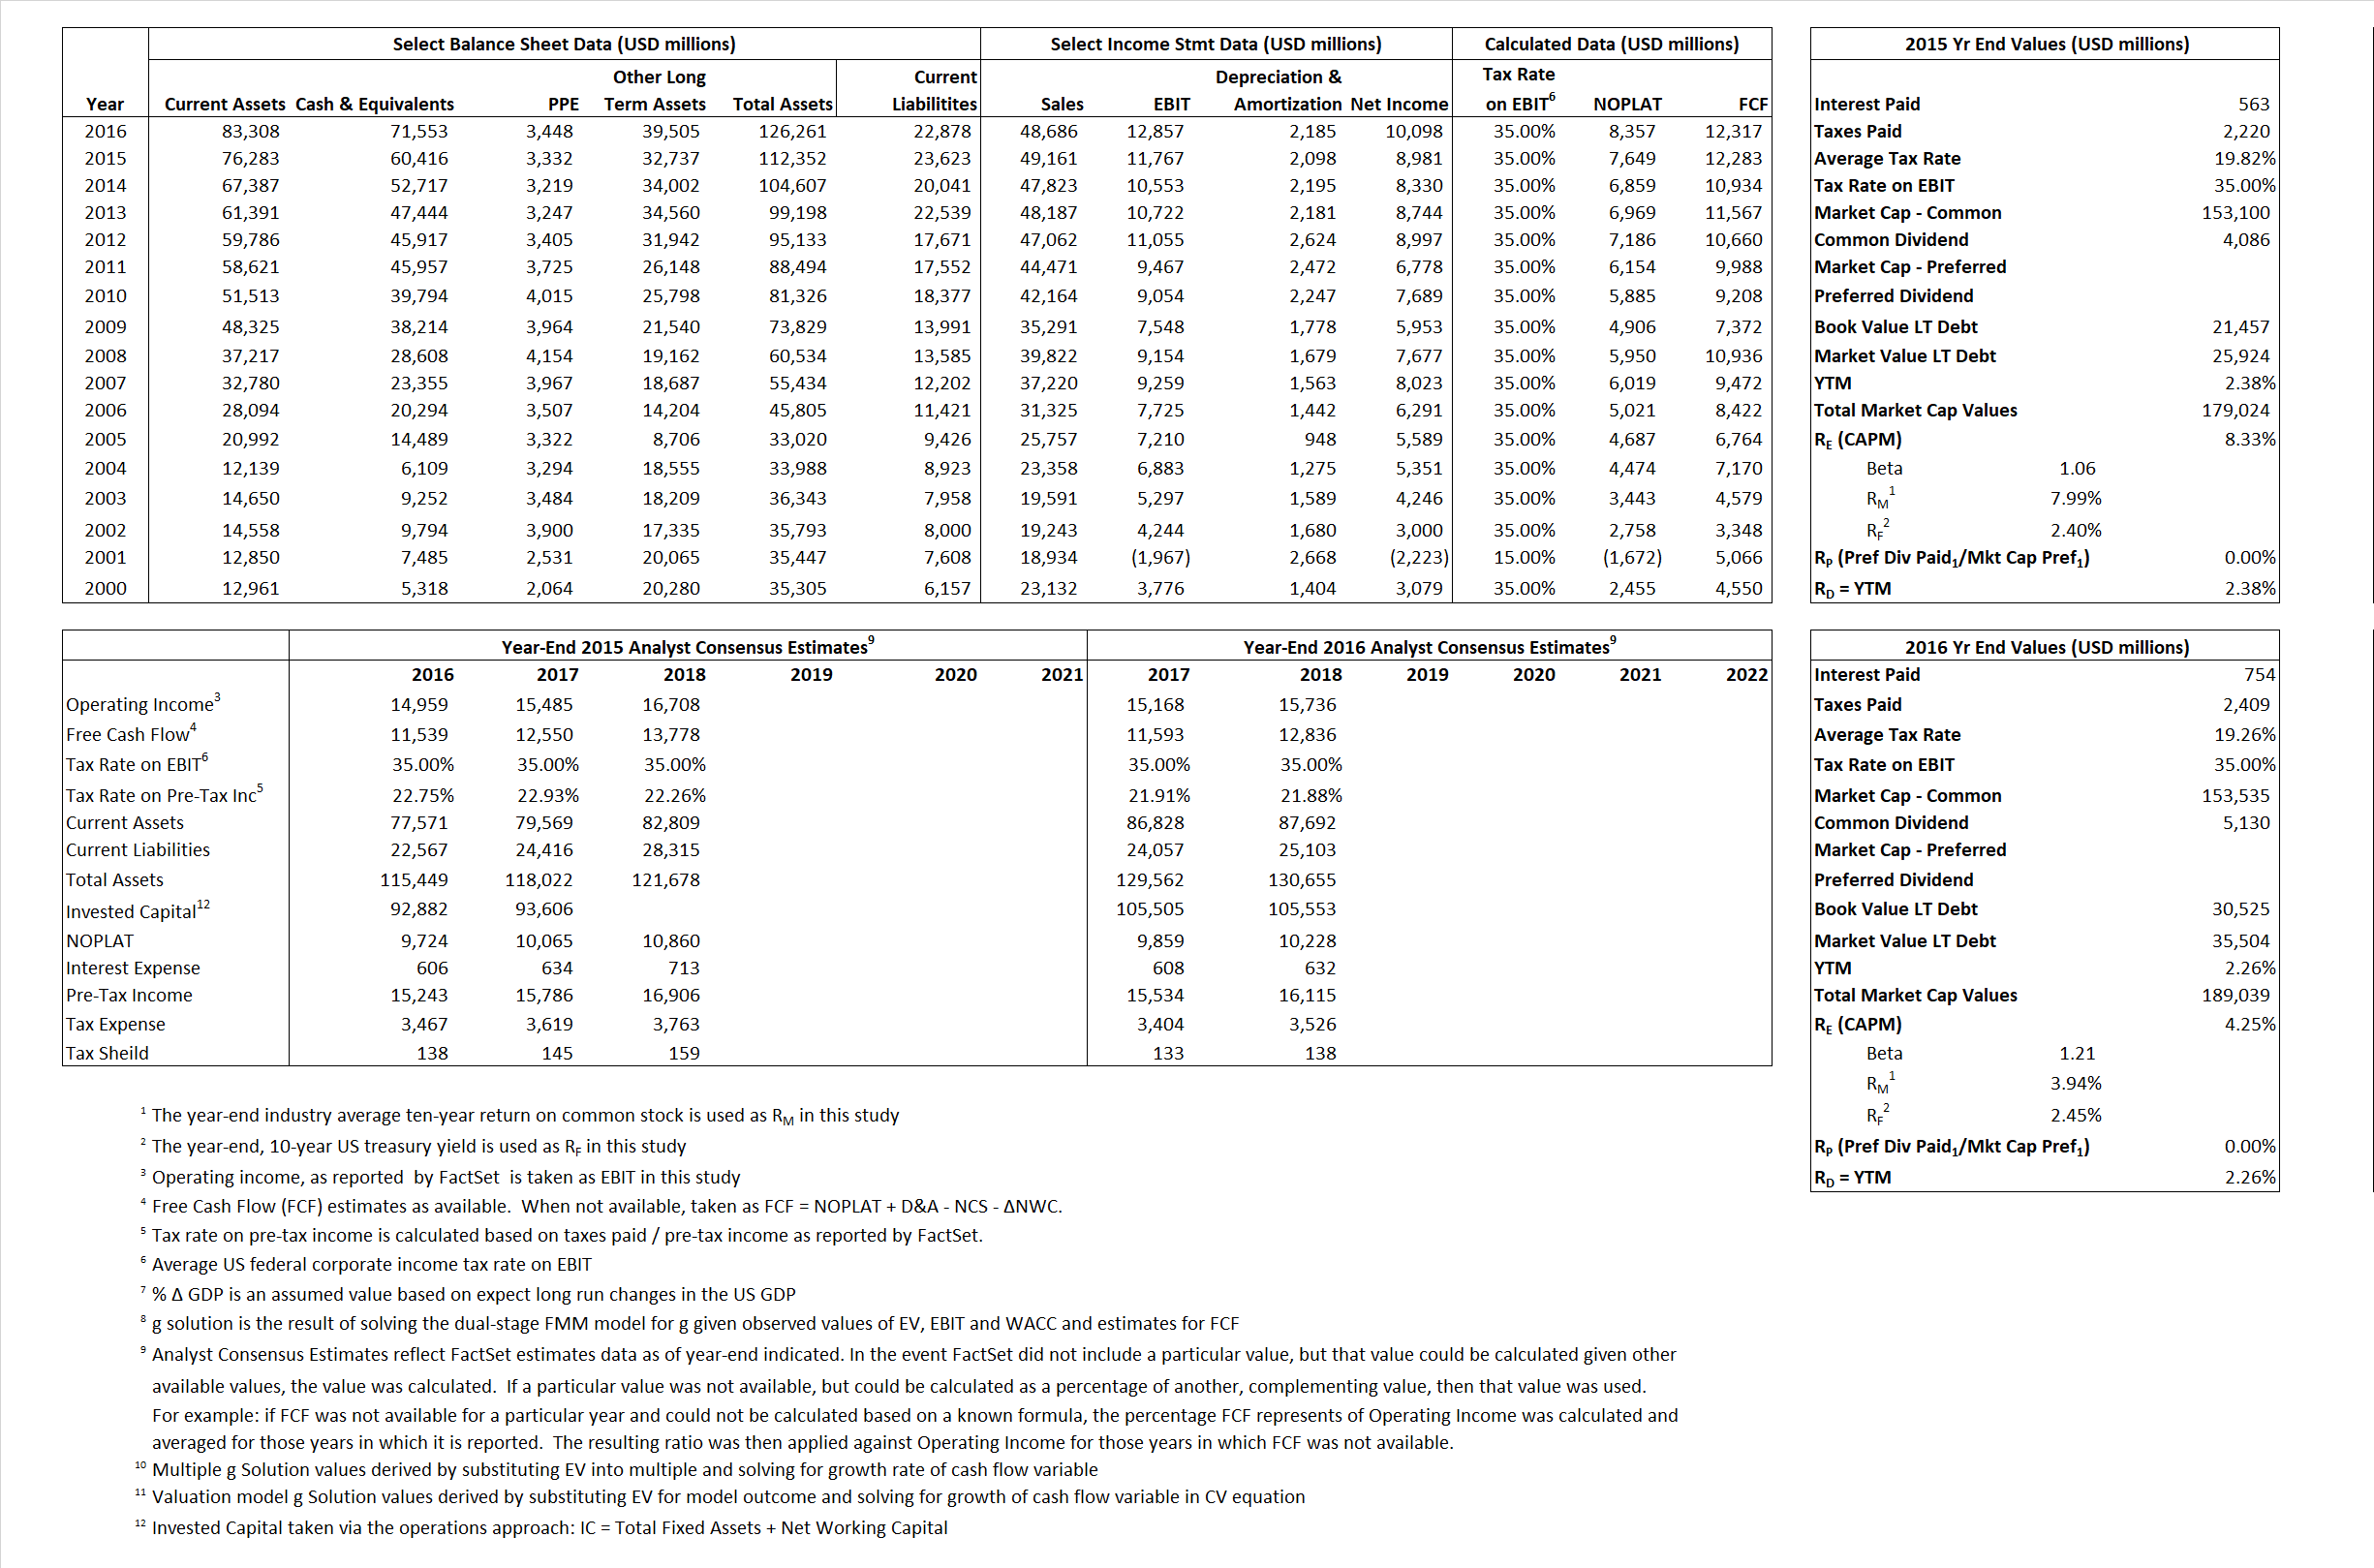
Primary Input Data
Derived Input Data
Derived Input |
Label |
2015 Value |
2016
|
Equational Form |
| Net Operating Profit Less Adjusted Taxes | NOPLAT | 7,649 | 8,357 |  |
| Free Cash Flow | FCF | 12,283 | 12,317 |  |
| Tax Shield | TS | 112 | 145 |  |
| Invested Capital | IC | 88,729 | 103,383 |  |
| Return on Invested Capital | ROIC | 8.62% | 8.08% |  |
| Net Investment | NetInv | 6,261 | 16,839 |  |
| Investment Rate | IR | 81.86% | 201.49% |  |
| Weighted Average Cost of Capital |
WACCMarket | 7.40% | 3.80% |  |
| WACCBook | 8.80% | 9.38% | ||
| Enterprise value |
EVMarket | 118,608 | 117,486 |  |
| EVBook | 114,141 | 112,507 | ||
| Long-Run Growth |
g = IR x ROIC |
7.06% | 16.29% | Long-run growth rates of the income variable are used in the Continuing Value portion of the valuation models. |
g = %  GDP GDP |
2.50% | 2.50% | ||
| Margin from Operations | M | 23.94% | 26.41% |  |
| Depreciation/Amortization Rate | D | 15.13% | 14.53% |  |
Valuation Multiple Outcomes
The outcomes presented in this study are the result of original input data, derived data, and synthesized inputs.
Equational Form |
Observed Value |
Single-stagemultiple g solution |
Two-stage valuationmodel g solution |
|||
| 12/31/2015 | 12/31/2016 | 12/31/2015 | 12/31/2016 | 12/31/2015 | 12/31/2016 | |
|
|
2.41 | 2.41 | 3.76% | -27.63% | 1.23% | -15.31% |
|
|
8.55 | 7.81 | 3.76% | -27.63% | 1.23% | -15.31% |
|
|
15.51 | 14.06 | 3.76% | -27.63% | 1.23% | -15.31% |
|
|
9.66 | 9.54 | 3.76% | -27.63% | 1.23% | -15.31% |
|
|
10.08 | 9.14 | 3.76% | -27.63% | 1.23% | -15.31% |
|
|
1.34 | 1.14 | 3.76% | -27.63% | 1.23% | -15.31% |


