JPMorgan Chase
Analyst Listings
The following analysts provide coverage for the subject firm as of May 2016:
| Broker | Analyst | Analyst Email |
| Oppenheimer | Chris Kotowski | chris.kotowski@opco.com |
| Keefe Bruyette & Woods | Christopher M. Mutascio | mutascioc@kbw.com |
| Atlantic Equities | Christopher Wheeler | c.wheeler@atlantic-equities.com |
| Drexel Hamilton | David Hilder | dhilder@drexelhamilton.com |
| Guggenheim Securities | Eric Wasserstrom | eric.wasserstrom@guggenheimpartners.com |
| RBC Capital Markets | Gerard Cassidy | gerard.cassidy@rbccm.com |
| Evercore ISI | Glenn Schorr | glenn.schorr@evercoreisi.com |
| BMO Capital Markets | James Fotheringham | james.fotheringham@bmo.com |
| Buckingham Research | James Mitchell | jmitchell@buckresearch.com |
| Sandler O’Neill & Partners | Jeffery J. Harte | jharte@sandleroneill.com |
| Bernstein Research | John E. McDonald | john.mcdonald@bernstein.com |
| Jefferies | Kenneth Usdin | kusdin@jefferies.com |
| Wells Fargo Securities | Matthew H. Burnell | matt.burnell@wellsfargo.com |
| Deutsche Bank Research | Matthew O’Connor | matthew.o-connor@db.com |
| Societe Generale | Murali Gopal | murali.gopal@sgcib.com |
| FBR Capital Markets & Co | Paul J. Miller | pmiller@fbr.com |
| Nomura Research | Steven Chubak | Steven.Chubak@nomura.com |
| Credit Suisse | Susan Roth Katzke | susan.katzke@credit-suisse.com |
Primary Input Data
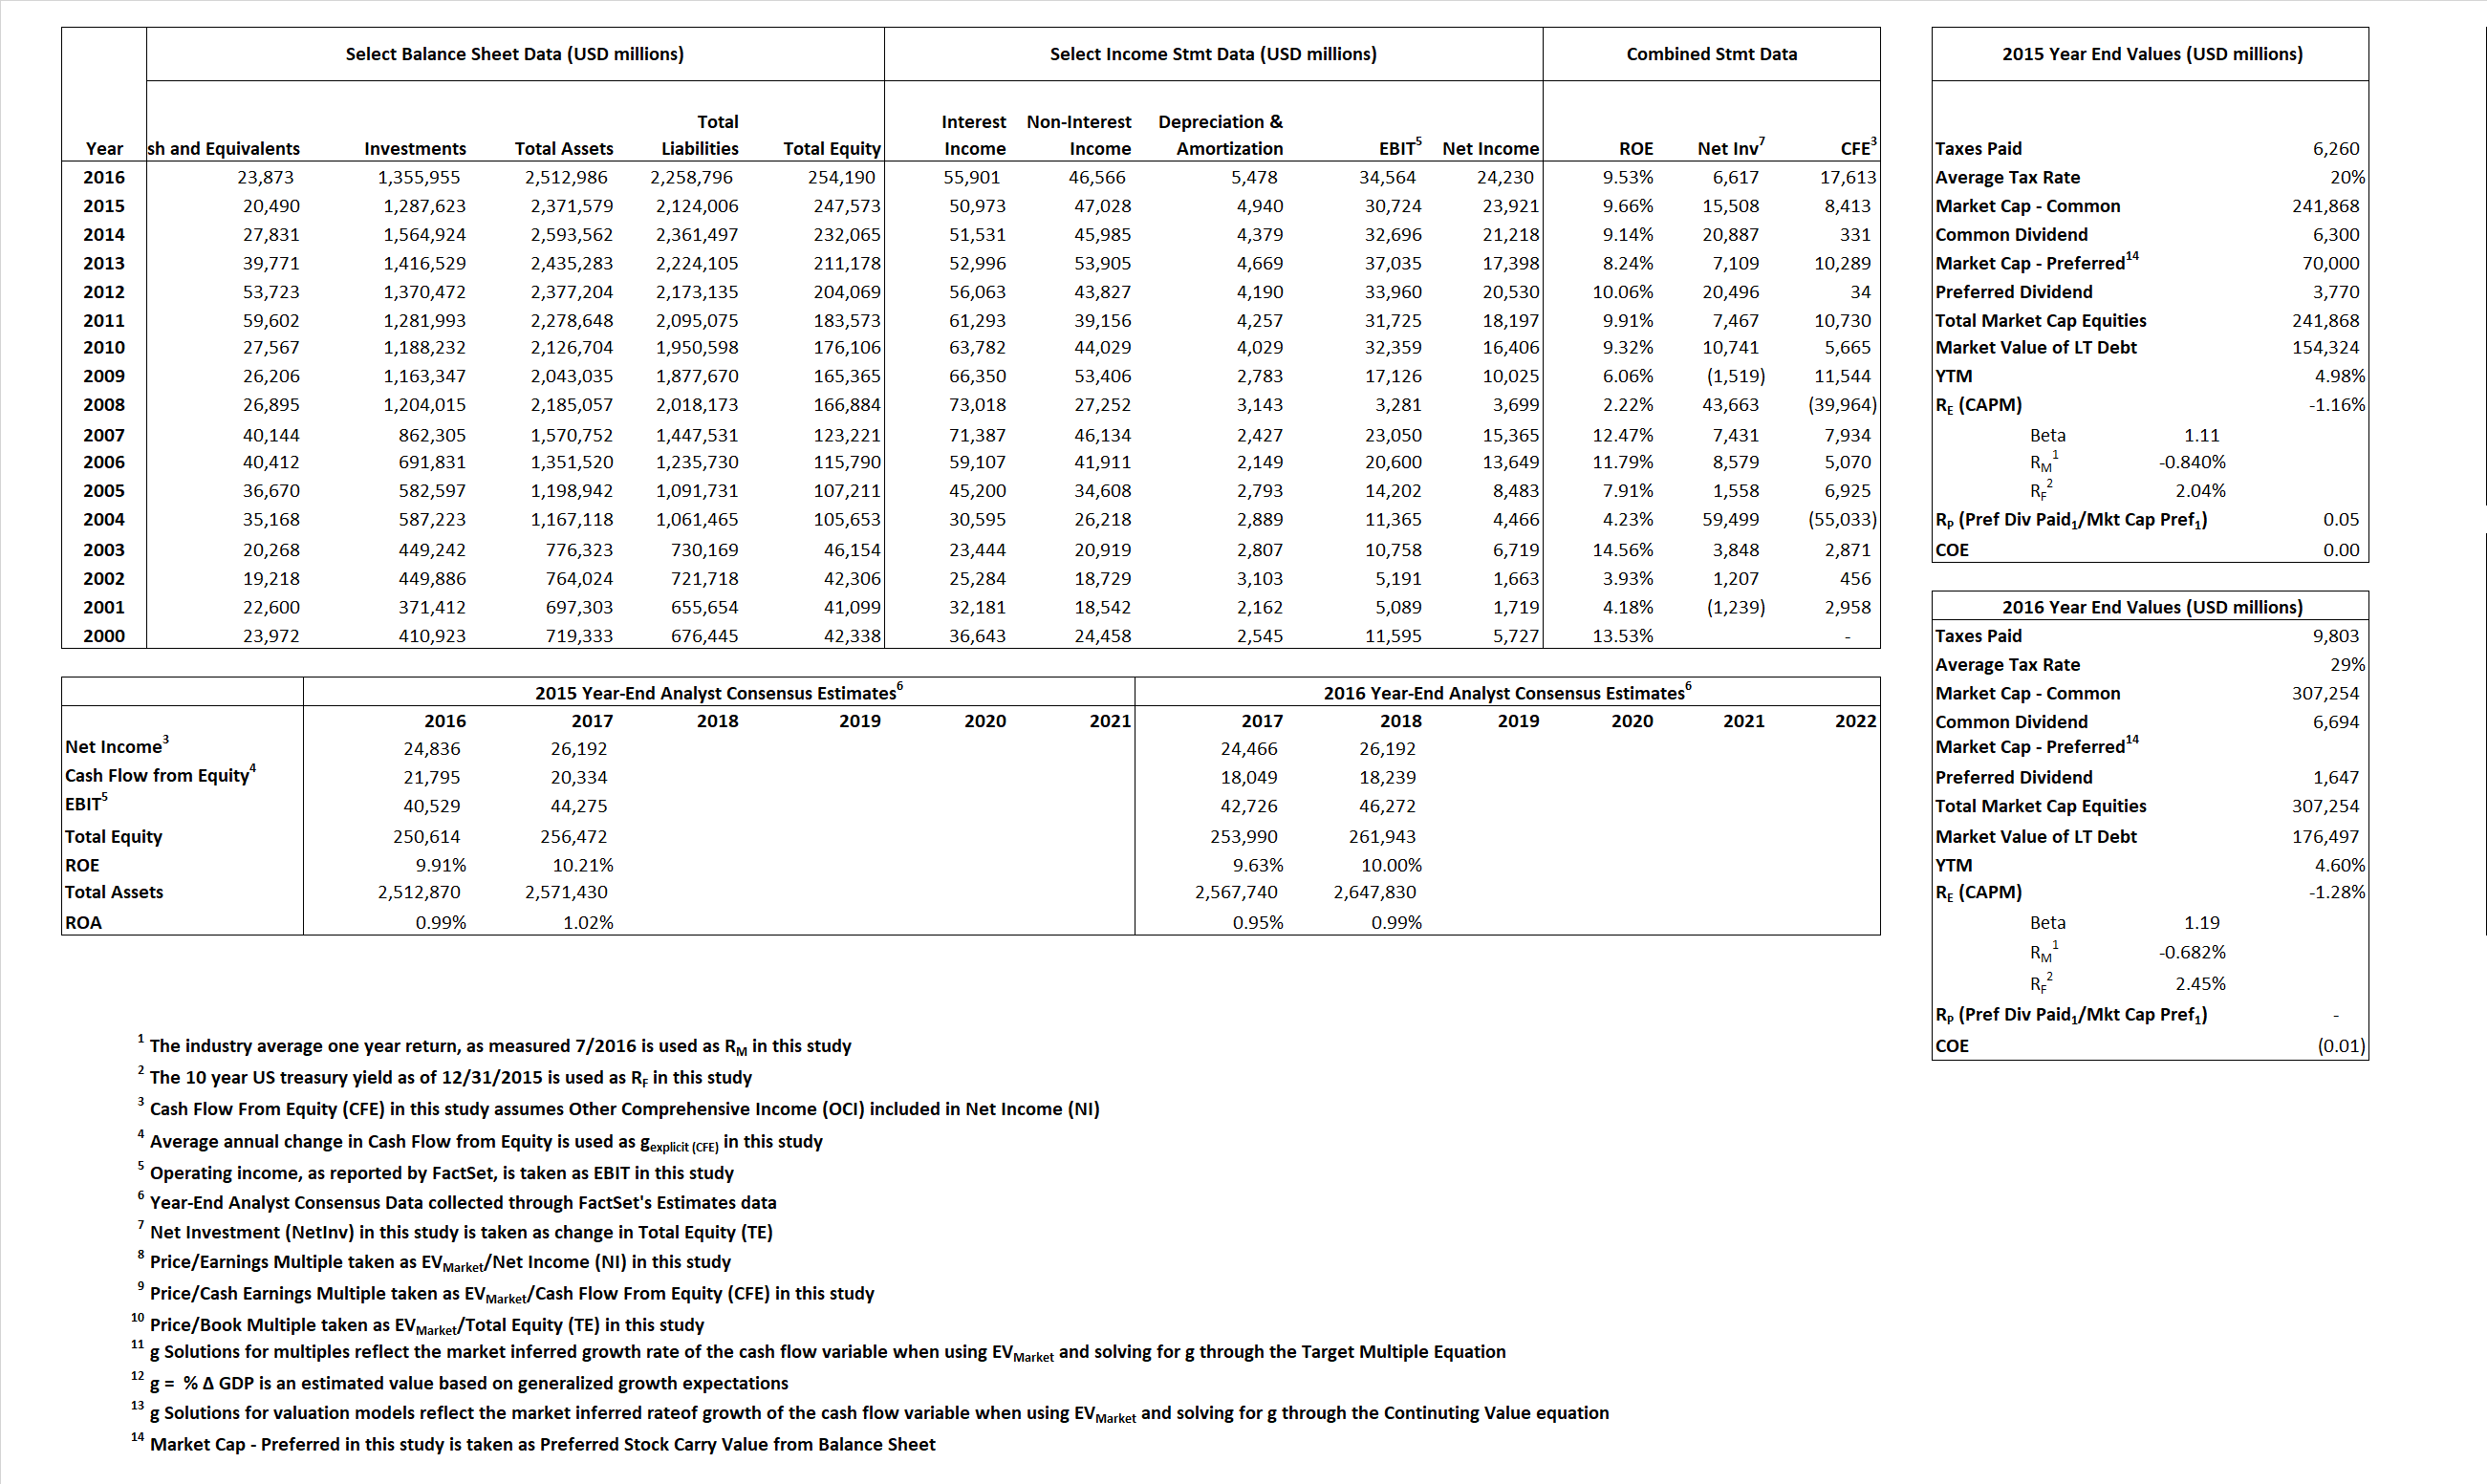
Derived Input Data
| Derived Input | Label |
2015 |
2016 |
Equational Form |
| Net Income | NI | 23,921 | 24,230 |  |
| Cash Flow From Equity | CFE | 8,413 | 17,613 |  |
| Total Equity | TE | 247,573 | 254,190 |  |
| Return on Equity | ROE | 9.66% | 9.53% |  |
| Net Investment | NetInv | 15,508 | 6,617 |  |
| Investment Rate | IR | 64.83% | 27.31% |  |
| Cost of Equity |
COE | -1.16% | -1.28% |  |
| Enterprise value |
EVMarket | 221,378 | 283,381 |  |
| Long-Run Growth |
g = IR x ROIC |
6.26% | 2.60% | Long-run growth rates of the income variable are used in the Continuing Value portion of the valuation models. |
g = %  GDP GDP |
2.50% | 2.50% |
Valuation Multiple Outcomes
The outcomes presented in this study are the result of original input data, derived data, and synthesized inputs.
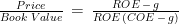
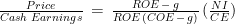
| Equational Form |
Observed Value |
Single-stage multiple g solution |
Two-stage valuation model g solution |
|||
| 12/31/2015 | 12/31/2016 | 12/31/2015 | 12/31/2016 | 12/31/2015 | 12/31/2016 | |
|
|
||||||
|
|
||||||
|
|
||||||