McDonald’s Corporation
Analyst Listing
The following analysts provide coverage for the subject firm as of May 2016:
| Broker | Analyst | Analyst Email |
| Longbow Research | Alton K. Stump | astump@longbowresearch.com |
| Cowen & Company | Andrew M. Charles | andrew.charles@cowen.com |
| Jefferies | Andy Barish | abarish@jefferies.com |
| Deutsche Bank Research | Brett Levy | brett.levy@db.com |
| Oppenheimer | Brian Bittner | brian.bittner@opco.com |
| Raymond James | Brian Vaccaro | brian.vaccaro@raymondjames.com |
| RBC Capital Markets | David Palmer | david.palmer@rbccm.com |
| SunTrust Robinson Humphrey | Jake Bartlett | jake.bartlett@suntrust.com |
| Credit Suisse | Jason West | jason.west@credit-suisse.com |
| Wells Fargo Securities | Jeff Farmer | jeff.farmer@wellsfargo.com |
| CRT Capital Group | Lynne Collier | lcollier@sterneageecrt.com |
| Nomura Research | Mark Kalinowski | mark.kalinowski@nomura.com |
| Evercore ISI | Matt McGinley | matt.mcginley@evercoreisi.com |
| Guggenheim Securities | Matthew J. Difrisco | matthew.difrisco@guggenheimpartners.com |
| Piper Jaffray | Nicole Miller Regan | nmr@pjc.com |
| Stifel Nicolaus | Paul Westra | paul.westra@stifel.com |
| BTIG | Peter Saleh | psaleh@btig.com |
| Stephens Inc | Will Slabaugh | will.slabaugh@stephens.com |
Primary Input Data
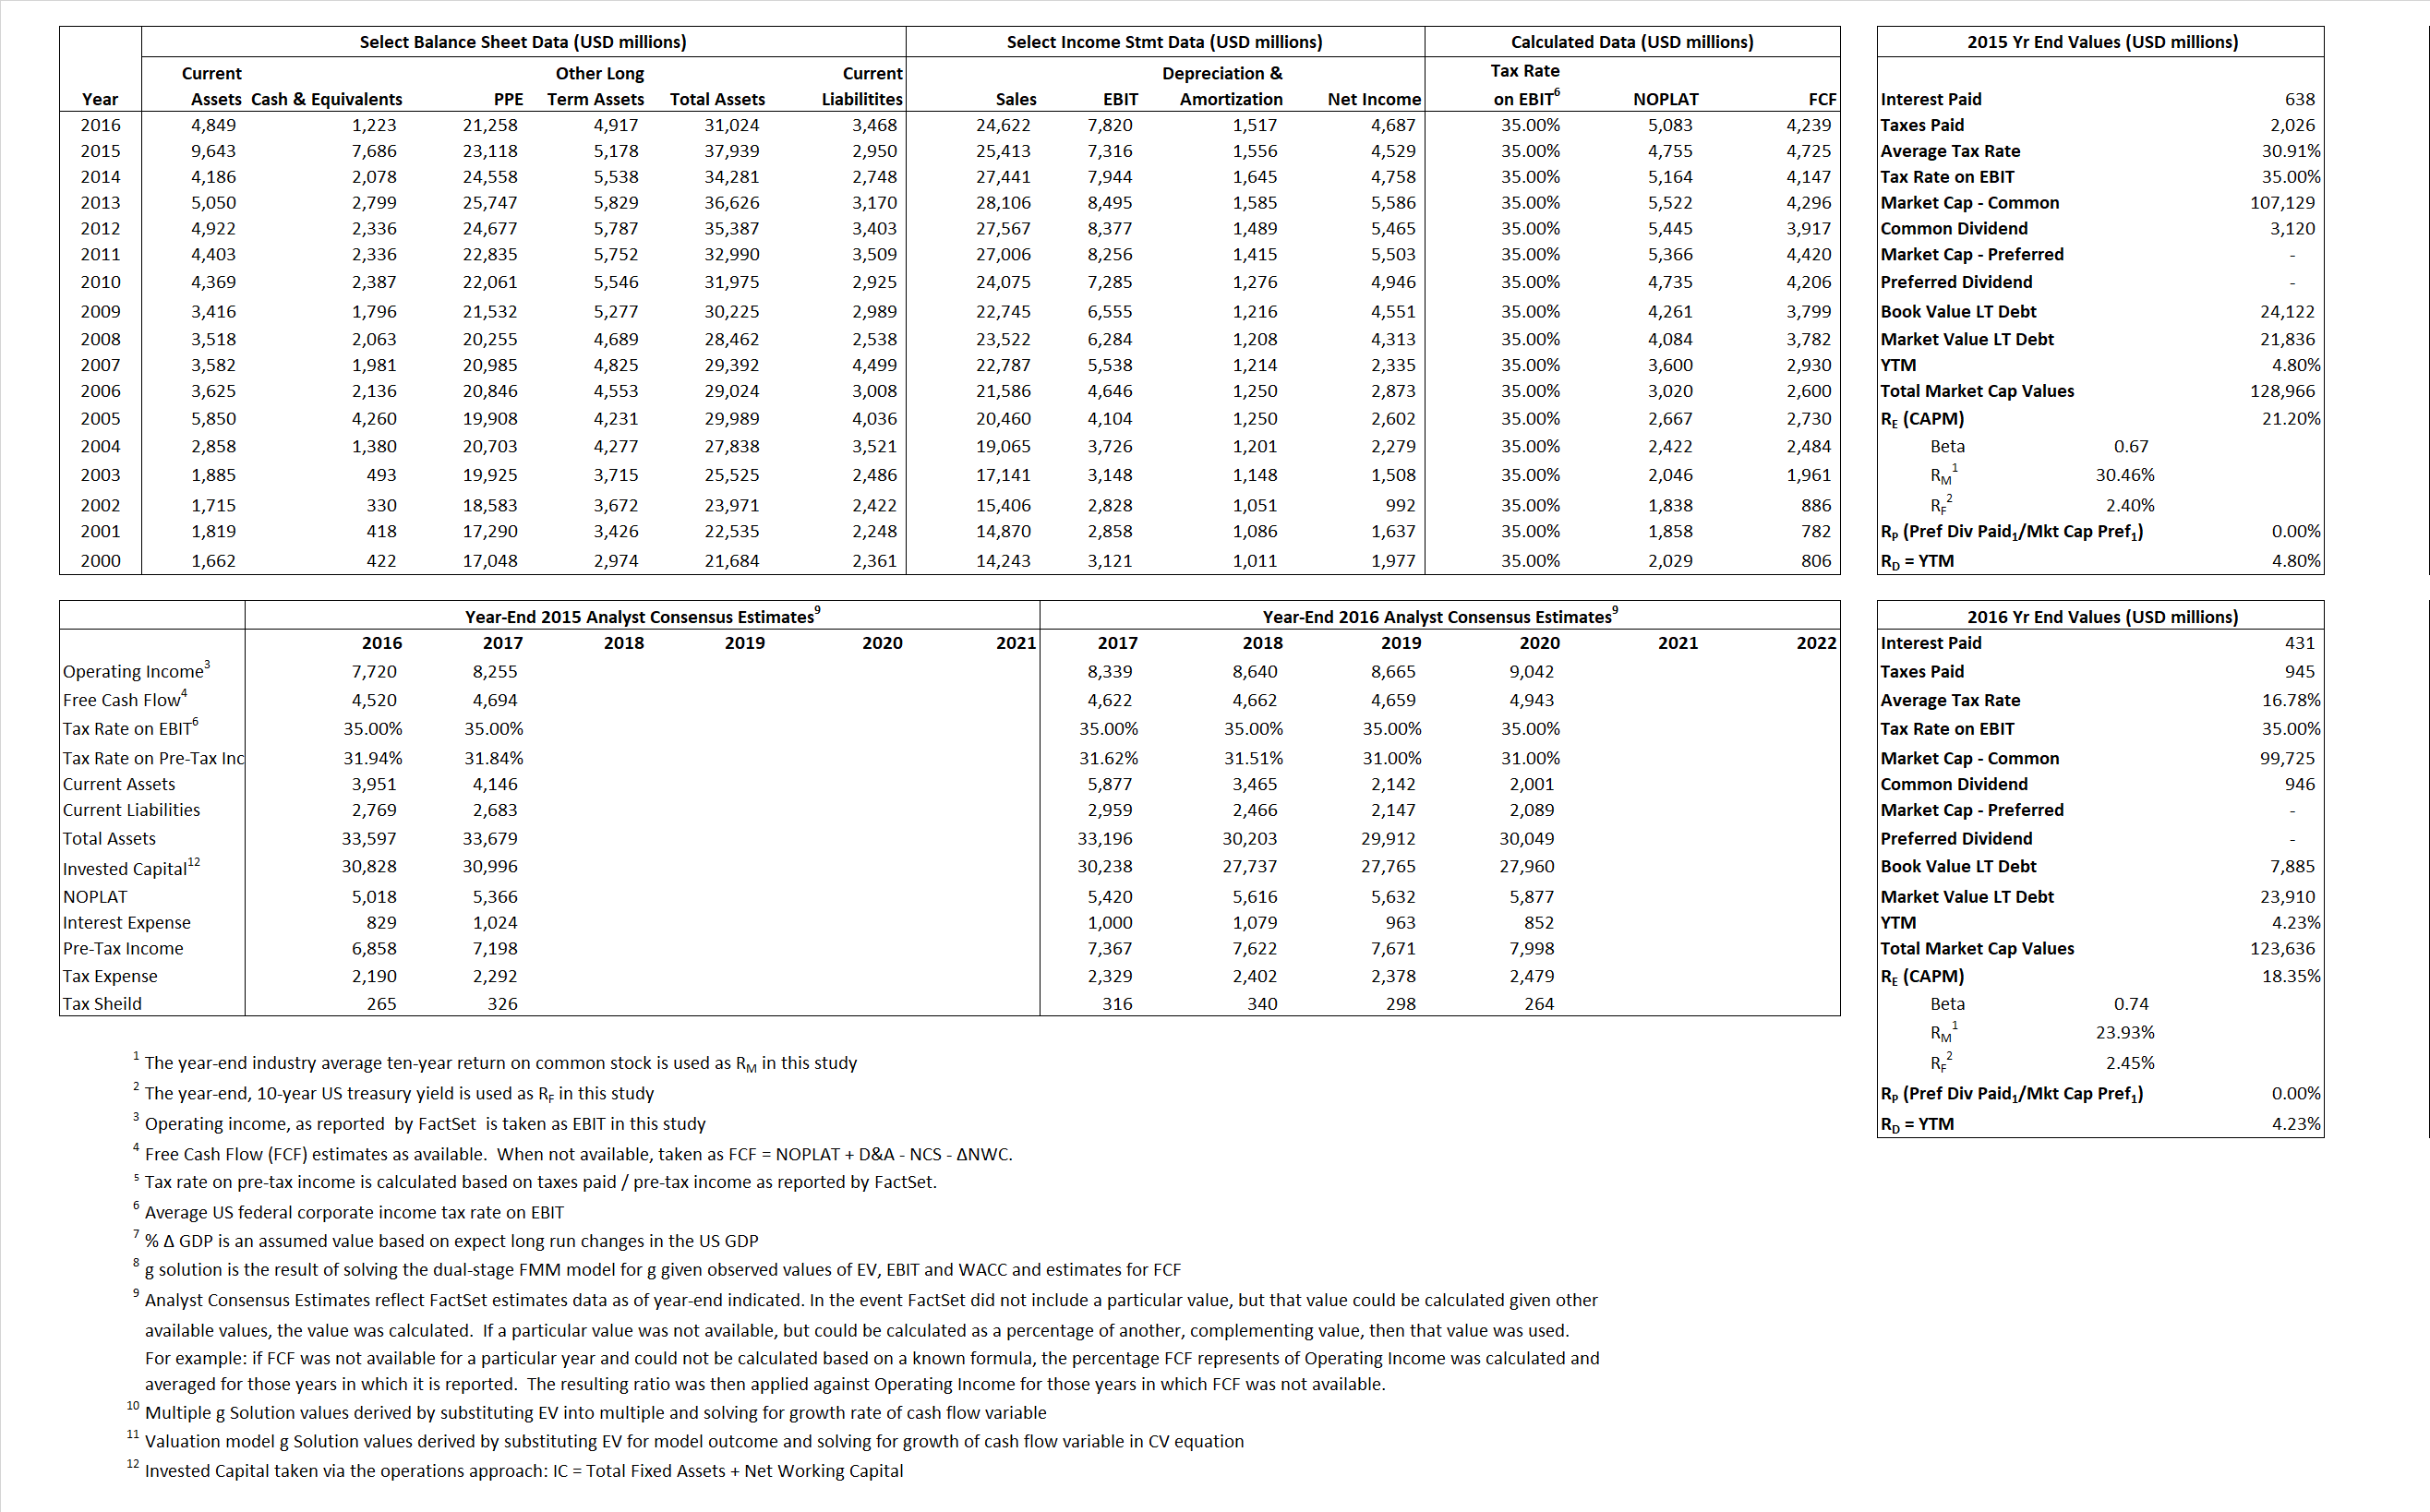
Derived Input Data
Derived Input |
Label |
2015 Value |
2016
|
Equational Form |
| Net Operating Profit Less Adjusted Taxes | NOPLAT | 4,755 | 5,083 |  |
| Free Cash Flow | FCF | 4,725 | 4,239 |  |
| Tax Shield | TS | 197 | 72 |  |
| Invested Capital | IC | 34,988 | 27,556 |  |
| Return on Invested Capital | ROIC | 13.59% | 18.45% |  |
| Net Investment | NetInv | 5,011 | (5,915) |  |
| Investment Rate | IR | 105.36% | -116.38% |  |
| Weighted Average Cost of Capital |
WACCMarket | 18.17% | 15.48% |  |
| WACCBook | 6.18% | 6.27% | ||
| Enterprise value |
EVMarket | 121,280 | 122,413 |  |
| EVBook | 130,028 | 106,387 | ||
| Long-Run Growth |
g = IR x ROIC |
14.32% | -21.47% | Long-run growth rates of the income variable are used in the Continuing Value portion of the valuation models. |
g = %  GDP GDP |
2.50% | 2.50% | ||
| Margin from Operations | M | 28.79% | 31.76% |  |
| Depreciation/Amortization Rate | D | 17.54% | 16.25% |  |
Valuation Multiple Outcomes
The outcomes presented in this study are the result of original input data, derived data, and synthesized inputs.
Equational Form |
Observed Value |
Single-stagemultiple g solution |
Two-stage valuationmodel g solution |
|||
| 12/31/2015 | 12/31/2016 | 12/31/2015 | 12/31/2016 | 12/31/2015 | 12/31/2016 | |
|
|
4.77 | 4.97 | 20.03% | 14.62% | 19.46% | 15.05% |
|
|
13.67 | 13.11 | 20.03% | 14.62% | 19.46% | 15.05% |
|
|
25.50 | 24.08 | 20.03% | 14.62% | 19.46% | 15.05% |
|
|
25.67 | 28.88 | 20.03% | 14.62% | 19.46% | 15.05% |
|
|
16.58 | 15.65 | 20.03% | 14.62% | 19.46% | 15.05% |
|
|
3.47 | 4.44 | 20.03% | 14.62% | 19.46% | 15.05% |


