Analyst Listing
The following analysts provide coverage for the subject firm as of May 2016:
| Broker | Analyst | Analyst Email |
| Bernstein Research | Carlos Kirjner | carlos.kirjner@bernstein.com |
| Mizuho Securities USA | Neil A. Doshi | neil.doshi@us.mizuho-sc.com |
| Monness Crespi Hardt | Cengiz M. Cakmak | jcakmak@mchny.com |
| Nomura Research | Anthony DiClemente | anthony.diclemente@nomura.com |
| Canaccord Genuity | Michael Graham | mgraham@canaccordgenuity.com |
| Axiom Capital | Victor Anthony | vanthony@axiomcapital.com |
| Piper Jaffray | Gene Munster | gene.a.munster@pjc.com |
| Jefferies | Brian Pitz | bpitz@jefferies.com |
| Pacific Crest Securities-KBCM | Evan Wilson | ewilson@key.com |
| Evercore ISI | Ken Sena | ken.sena@evercoreisi.com |
| Pivotal Research Group | Brian Wieser | brian@pvtl.com |
| Guggenheim Securities | Jake Fuller | james.fuller@guggenheimpartners.com |
| FBN Securities | Shebly Seyrafi | sseyrafi@fbnsecurities.com |
| RBC Capital Markets | Mark S. Mahaney | mark.mahaney@rbccm.com |
| Cantor Fitzgerald | Youssef H. Squali | ysquali@cantor.com |
| Atlantic Equities | James Cordwell | j.cordwell@atlantic-equities.com |
| Susquehanna Financial Group | Shyam Patil | shyam.patil@sig.com |
| Cowen & Company | John Blackledge | john.blackledge@cowen.com |
| SunTrust Robinson Humphrey | Robert S. Peck | robert.peck@suntrust.com |
| JMP Securities | Ronald V. Josey | rjosey@jmpsecurities.com |
| B Riley & Co | Sameet Sinha | ssinha@brileyco.com |
| Wells Fargo Securities | Peter Stabler | peter.stabler@wellsfargo.com |
| Wedbush Securities | James Dix | james.dix@wedbush.com |
| Hilliard Lyons | Stephen Turner | sturner@hilliard.com |
| Stifel Nicolaus | Scott W. Devitt | swdevitt@stifel.com |
| Oppenheimer | Jason Helfstein | jason.helfstein@opco.com |
| Needham | Kerry Rice | krice@needhamco.com |
| Daiwa Securities Co. Ltd. | Kazuya Nishimura | kazuya.nishimura@us.daiwacm.com |
| Raymond James | Aaron Kessler | aaron.kessler@raymondjames.com |
| William Blair | Ralph Schackart | rschackart@williamblair.com |
| BMO Capital Markets | Daniel Salmon | dan.salmon@bmo.com |
| Credit Suisse | Stephen Ju | stephen.ju@credit-suisse.com |
| Deutsche Bank Research | Ross Sandler | ross.sandler@db.com |
| BGC Financial, L.P. | Colin W. Gillis | cgillis@bgcpartners.com |
Primary Input Data
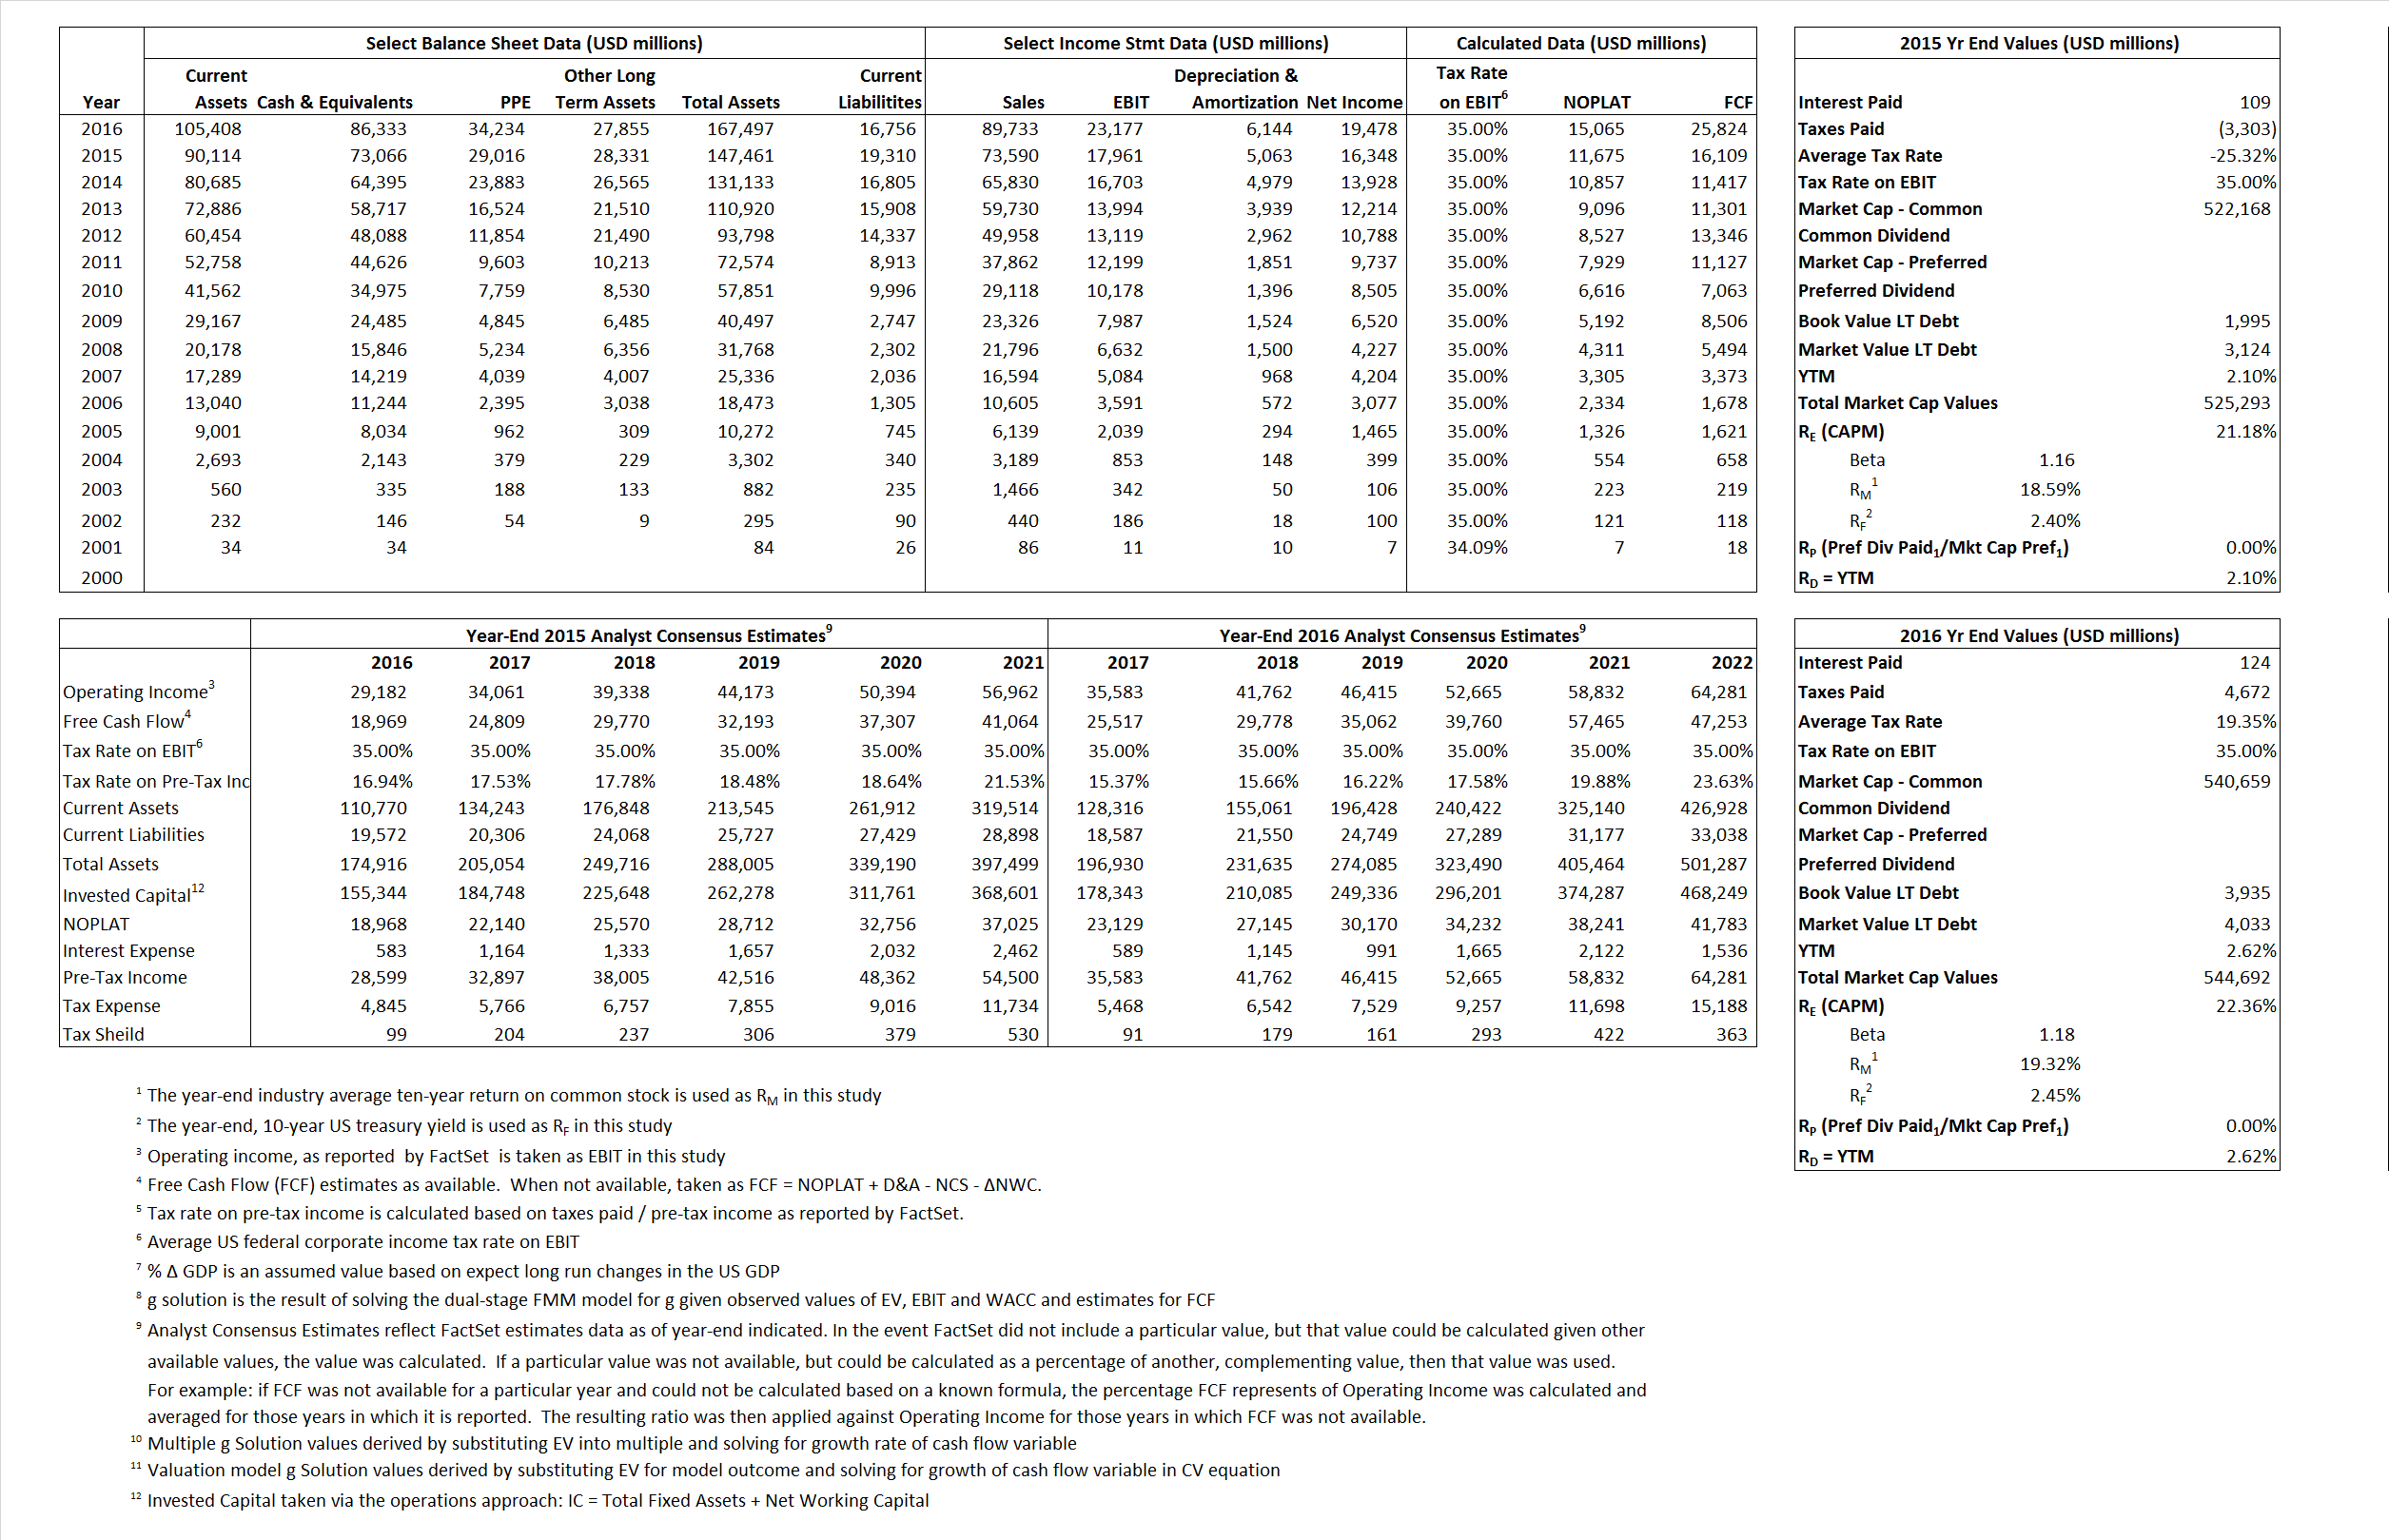
Derived Input Data
Derived Input |
Label |
2015 Value |
2016
|
Equational Form |
| Net Operating Profit Less Adjusted Taxes | NOPLAT | 11,675 | 15,065 |  |
| Free Cash Flow | FCF | 16,109 | 25,824 |  |
| Tax Shield | TS | (28) | 24 |  |
| Invested Capital | IC | 128,151 | 150,741 |  |
| Return on Invested Capital | ROIC | 9.11% | 9.99% |  |
| Net Investment | NetInv | 18,886 | 28,734 |  |
| Investment Rate | IR | 161.77% | 190.73% |  |
| Weighted Average Cost of Capital |
WACCMarket | 21.07% | 22.21% |  |
| WACCBook | 10.46% | 10.12% | ||
| Enterprise value |
EVMarket | 452,227 | 458,359 |  |
| EVBook | 451,097 | 458,261 | ||
| Long-Run Growth |
g = IR x ROIC |
14.74% | 19.06% | Long-run growth rates of the income variable are used in the Continuing Value portion of the valuation models. |
g = %  GDP GDP |
2.50% | 2.50% | ||
| Margin from Operations | M | 24.41% | 25.83% |  |
| Depreciation/Amortization Rate | D | 21.99% | 20.95% |  |
Valuation Multiple Outcomes
The outcomes presented in this study are the result of original input data, derived data, and synthesized inputs.
Equational Form |
Observed Value |
Single-stagemultiple g solution |
Two-stage valuationmodel g solution |
|||
| 12/31/2015 | 12/31/2016 | 12/31/2015 | 12/31/2016 | 12/31/2015 | 12/31/2016 | |
|
|
6.15 | 5.11 | 25.80% | 28.19% | 22.89% | 23.88% |
|
|
19.64 | 15.63 | 25.80% | 28.19% | 22.89% | 23.88% |
|
|
38.74 | 30.43 | 25.80% | 28.19% | 22.89% | 23.88% |
|
|
28.07 | 17.75 | 25.80% | 28.19% | 22.89% | 23.88% |
|
|
25.18 | 19.78 | 25.80% | 28.19% | 22.89% | 23.88% |
|
|
3.53 | 3.04 | 25.80% | 28.19% | 22.89% | 23.88% |


