UnitedHealth Group Incorporated
Analyst Listing
The following analysts provide coverage for the subject firm as of May 2016:
| Broker | Analyst | Analyst Email |
| Leerink Partners | Ana Gupte | ana.gupte@leerink.com |
| CRT Capital Group | Brian Wright | bwright@sterneageecrt.com |
| Susquehanna Financial Group | Chris Rigg | chris.rigg@sig.com |
| Cowen & Company | Christine Arnold | christine.arnold@cowen.com |
| Jefferies | David Windley | dwindley@jefferies.com |
| RBC Capital Markets | Frank G. Morgan | frank.morgan@rbccm.com |
| Cantor Fitzgerald | Joseph D. France | jfrance@cantor.com |
| Raymond James | Michael J. Baker | michael.baker@raymondjames.com |
| Oppenheimer | Michael Wiederhorn | michael.wiederhorn@opco.com |
| Wells Fargo Securities | Peter Costa | peter.costa@wellsfargo.com |
| Wedbush Securities | Sarah James | sarah.james@wedbush.com |
| Credit Suisse | Scott Fidel | scott.fidel@credit-suisse.com |
| Piper Jaffray | Sean W. Wieland | sean.w.wieland@pjc.com |
| Mizuho Securities USA | Sheryl R. Skolnick | sheryl.skolnick@us.mizuho-sc.com |
| FBR Capital Markets & Co | Steven Halper | shalper@fbr.com |
| Stifel Nicolaus | Thomas A. Carroll | tacarroll@stifel.com |
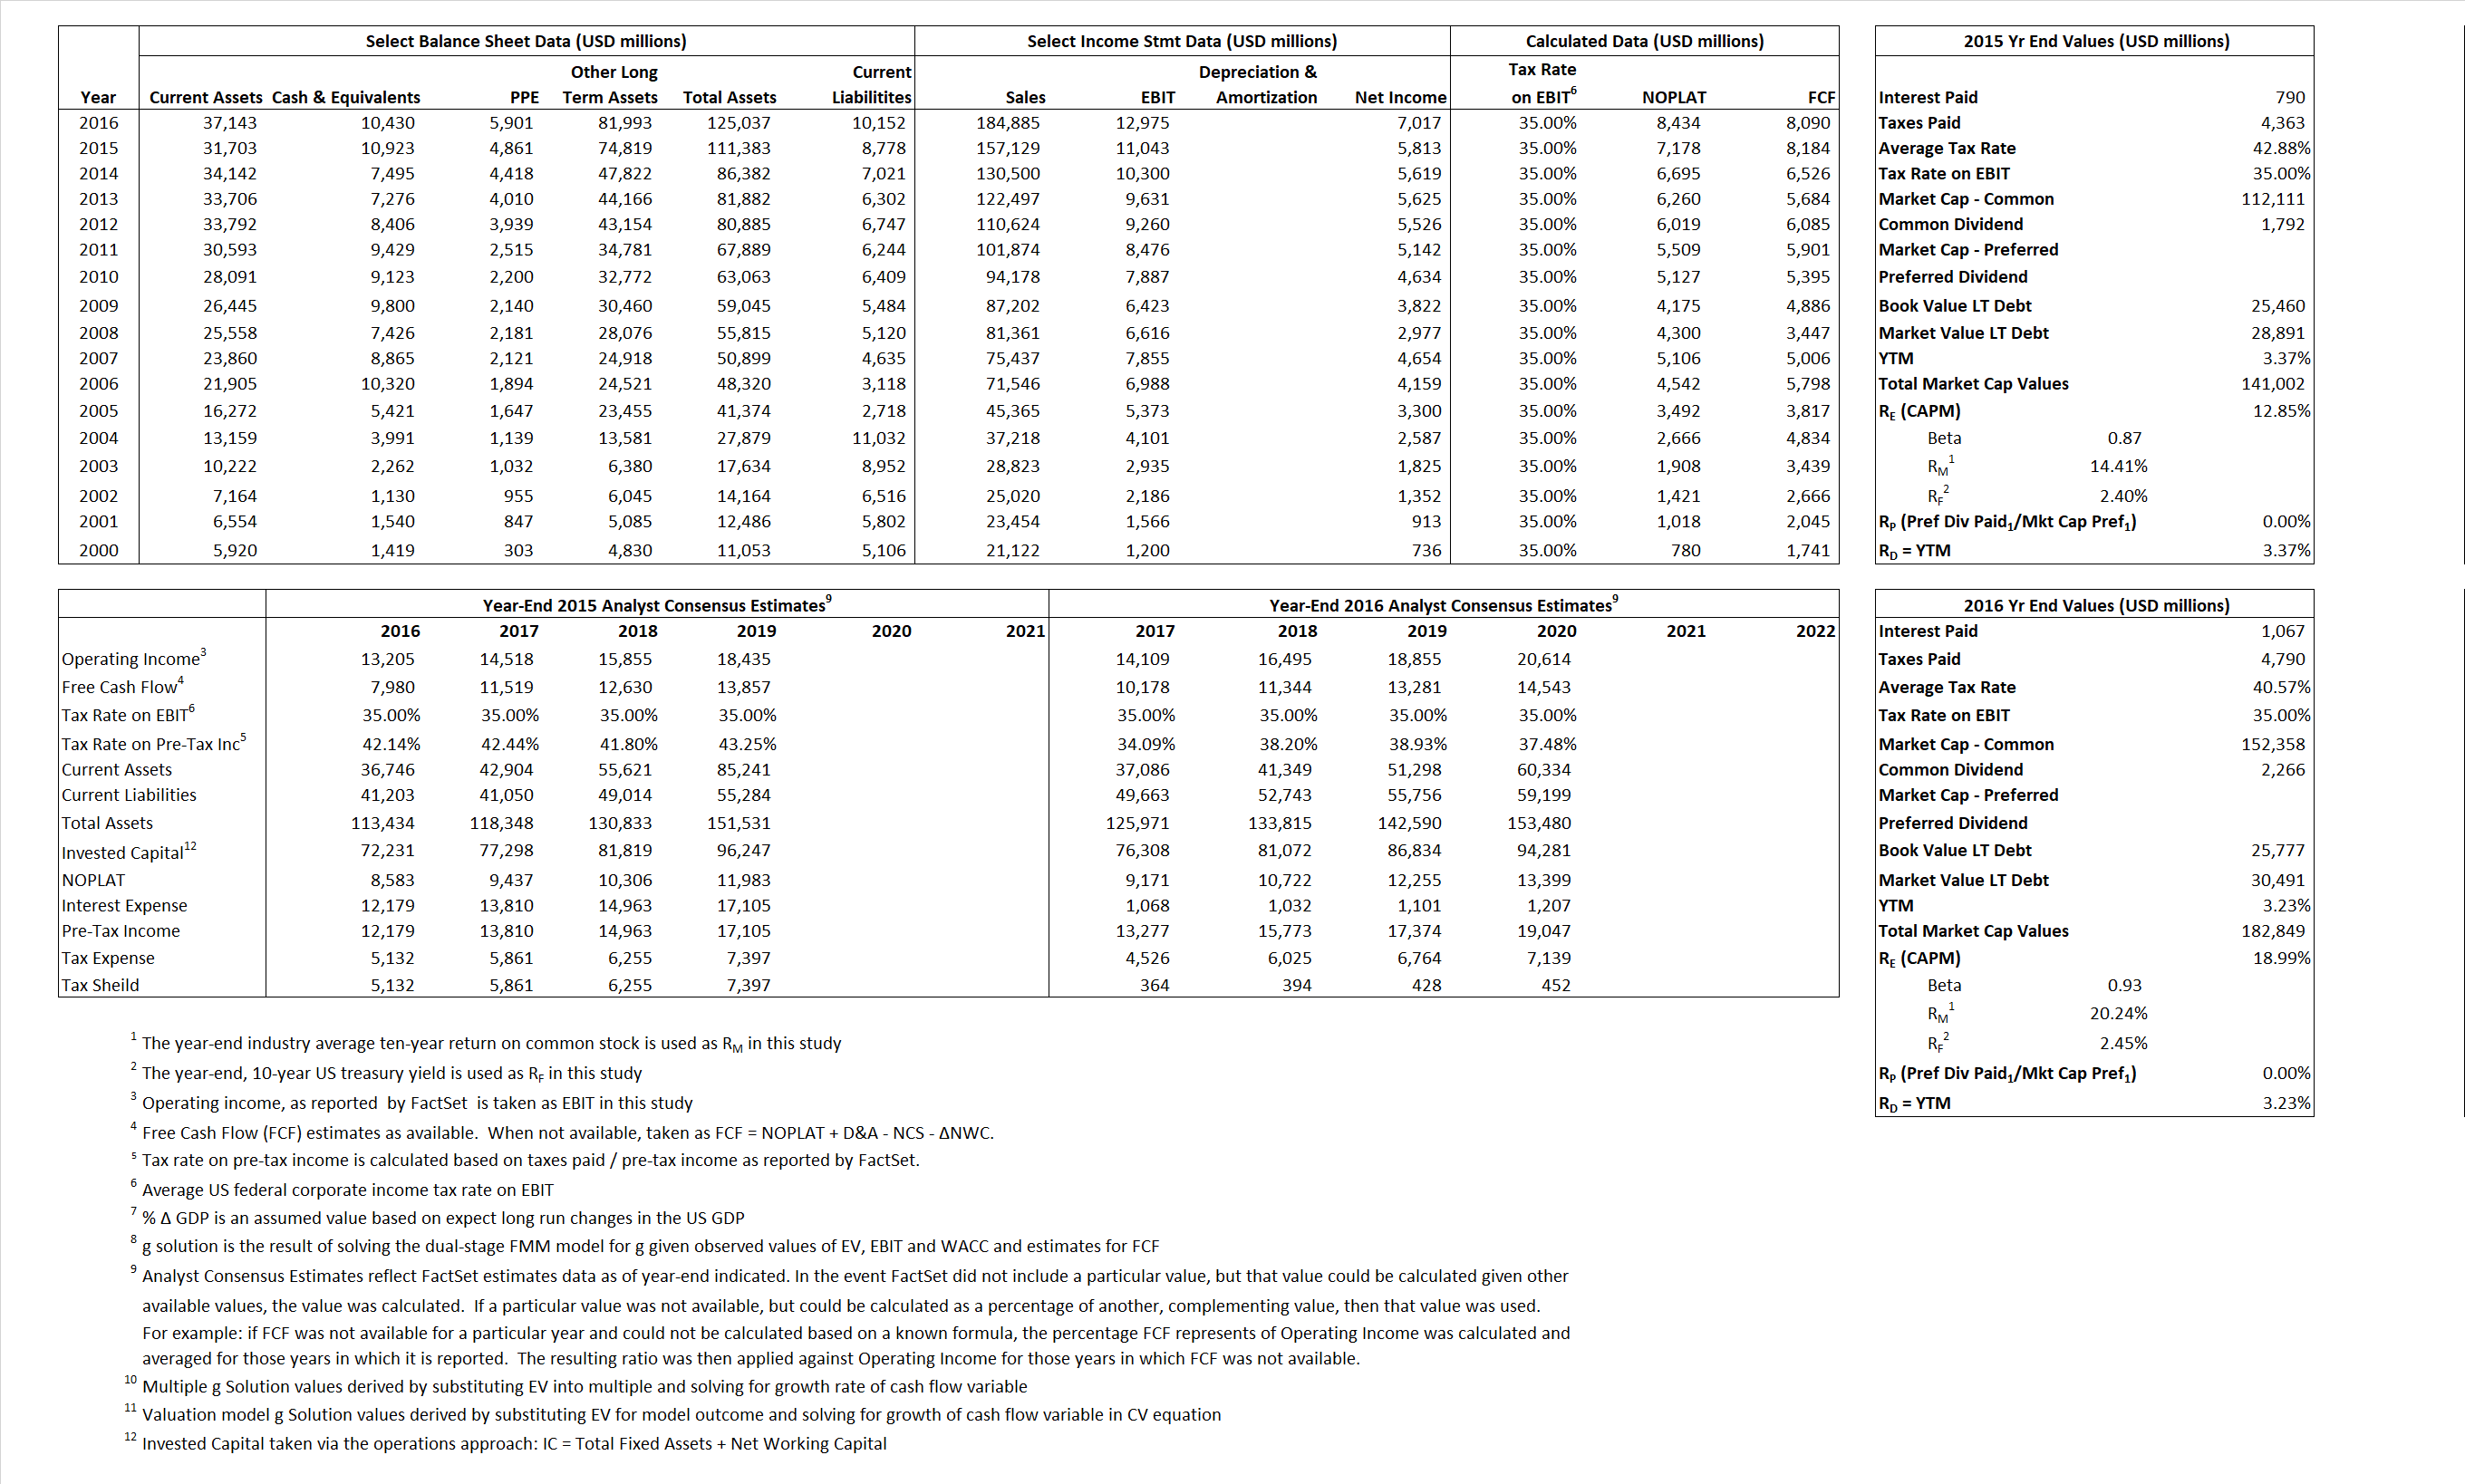
Primary Input Data
Derived Input Data
Derived Input |
Label |
2015 Value |
2016
|
Equational Form |
| Net Operating Profit Less Adjusted Taxes | NOPLAT | 7,178 | 8,434 |  |
| Free Cash Flow | FCF | 8,184 | 8,090 |  |
| Tax Shield | TS | 339 | 433 |  |
| Invested Capital | IC | 102,605 | 114,885 |  |
| Return on Invested Capital | ROIC | 7.00% | 7.34% |  |
| Net Investment | NetInv | 23,244 | 12,280 |  |
| Investment Rate | IR | 323.83% | 145.61% |  |
| Weighted Average Cost of Capital |
WACCMarket | 10.61% | 16.15% |  |
| WACCBook | 6.94% | 7.30% | ||
| Enterprise value |
EVMarket | 130,079 | 172,419 |  |
| EVBook | 127,141 | 167,705 | ||
| Long-Run Growth |
g = IR x ROIC |
22.65% | 10.69% | Long-run growth rates of the income variable are used in the Continuing Value portion of the valuation models. |
g = %  GDP GDP |
2.50% | 2.50% | ||
| Margin from Operations | M | 7.03% | 7.02% |  |
| Depreciation/Amortization Rate | D | 0.00% | 0.00% |  |
Valuation Multiple Outcomes
The outcomes presented in this study are the result of original input data, derived data, and synthesized inputs.
Equational Form |
Observed Value |
Single-stagemultiple g solution |
Two-stage valuationmodel g solution |
|||
| 12/31/2015 | 12/31/2016 | 12/31/2015 | 12/31/2016 | 12/31/2015 | 12/31/2016 | |
|
|
0.83 | 0.93 | 24.11% | 33.37% | 20.03% | 21.23% |
|
|
11.78 | 13.29 | 24.11% | 33.37% | 20.03% | 21.23% |
|
|
18.12 | 20.44 | 24.11% | 33.37% | 20.03% | 21.23% |
|
|
15.89 | 21.31 | 24.11% | 33.37% | 20.03% | 21.23% |
|
|
11.78 | 13.29 | 24.11% | 33.37% | 20.03% | 21.23% |
|
|
1.27 | 1.50 | 24.11% | 33.37% | 20.03% | 21.23% |


