Target Corporation
Analyst Listing
The following analysts provide coverage for the subject firm as of May 2016:
| Broker | Analyst | Analyst Email |
| Jefferies | Daniel Binder | dbinder@jefferies.com |
| Consumer Edge Research | David A. Schick | dschick@consumeredgeresearch.com |
| Evercore ISI | Greg Melich | greg.melich@evercoreisi.com |
| Cowen & Company | Jason H. Seidl | jason.seidl@cowen.com |
| Buckingham Research | John Zolidis | jzolidis@buckresearch.com |
| Telsey Advisory Group | Joseph Feldman | jfeldman@telseygroup.com |
| Daiwa Securities Co. Ltd. | Kahori Tamada | kahori.tamada@us.daiwacm.com |
| Credit Suisse | Michael Exstein | michael.exstein@credit-suisse.com |
| Deutsche Bank Research | Paul Trussell | paul.trussell@db.com |
| CRT Capital Group | Renato Basanta | rbasanta@sterneageecrt.com |
| Nomura Research | Robert S. Drbul | robert.drbul@nomura.com |
| Wolfe Research | Scott Mushkin | smushkin@wolferesearch.com |
| Piper Jaffray | Sean P. Naughton | sean.p.naughton@pjc.com |
| BMO Capital Markets | Wayne Hood | wayne.hood@bmo.com |
Primary Input Data
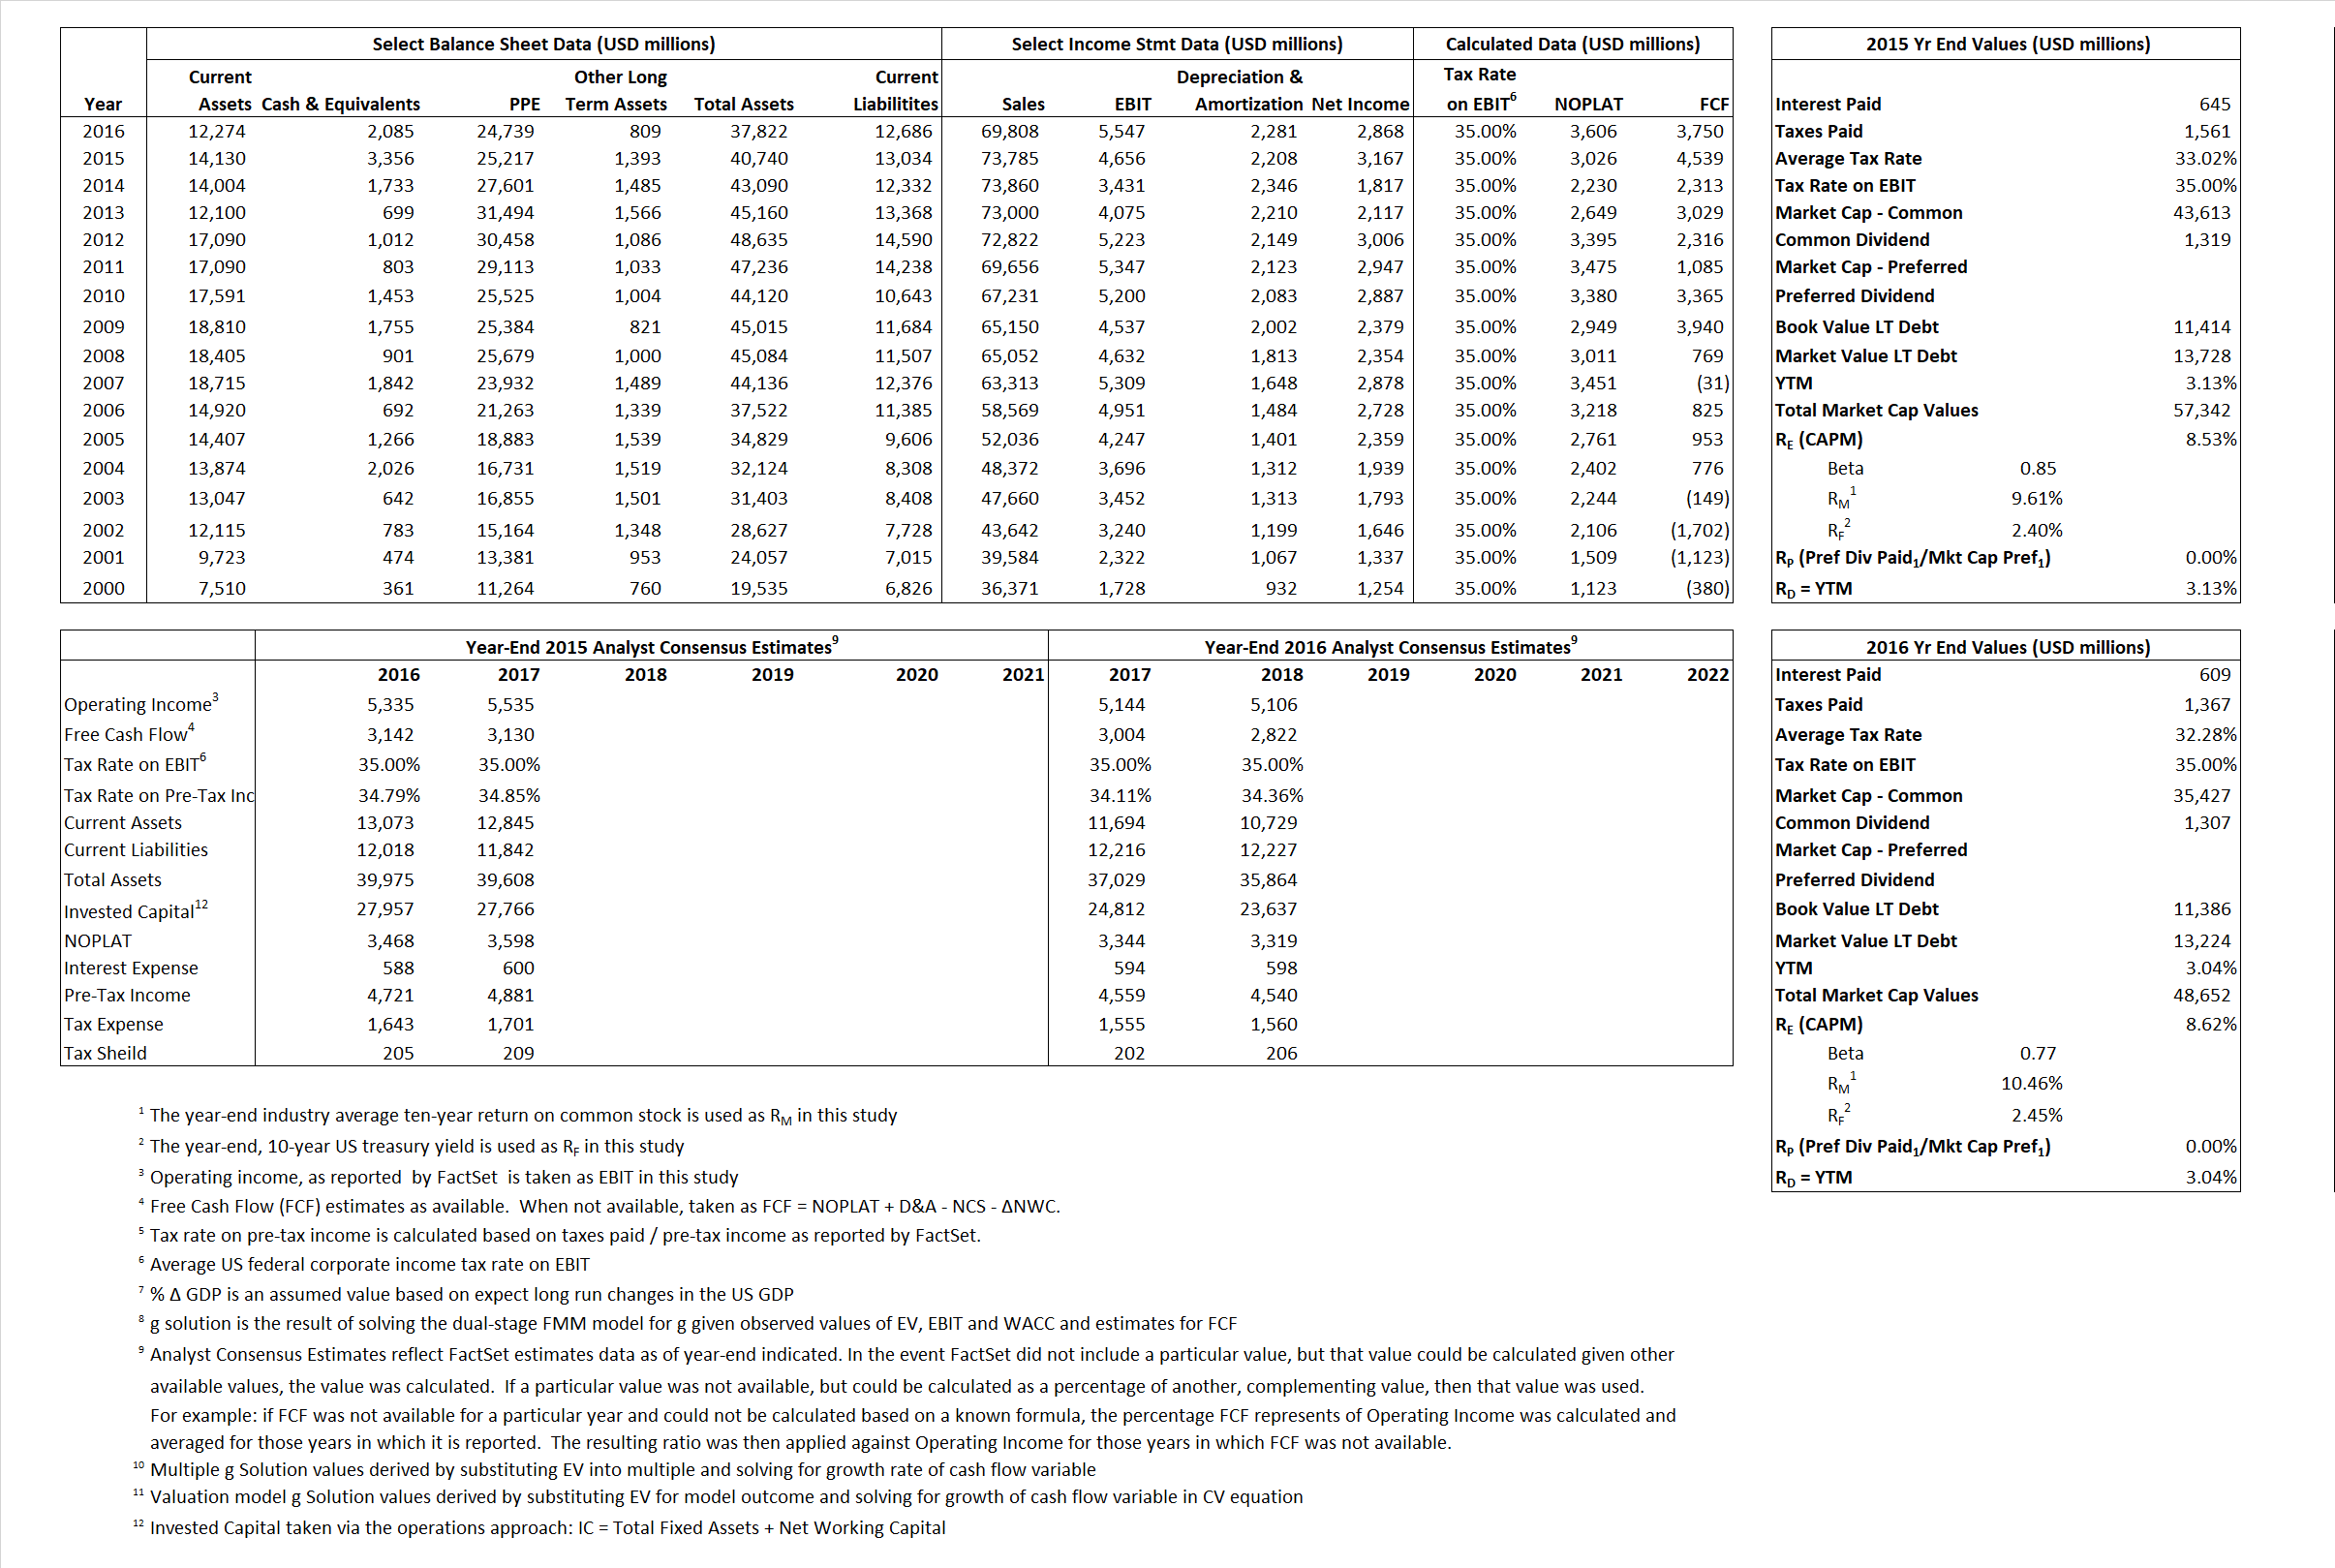
Derived Input Data
Derived Input |
Label |
2015 Value |
2016
|
Equational Form |
| Net Operating Profit Less Adjusted Taxes | NOPLAT | 3,026 | 3,606 |  |
| Free Cash Flow | FCF | 4,539 | 3,750 |  |
| Tax Shield | TS | 213 | 197 |  |
| Invested Capital | IC | 27,706 | 25,136 |  |
| Return on Invested Capital | ROIC | 10.92% | 14.34% |  |
| Net Investment | NetInv | (843) | (289) |  |
| Investment Rate | IR | -27.87% | -8.02% |  |
| Weighted Average Cost of Capital |
WACCMarket | 6.99% | 6.83% |  |
| WACCBook | 6.42% | 6.17% | ||
| Enterprise value |
EVMarket | 53,986 | 46,567 |  |
| EVBook | 52,942 | 44,728 | ||
| Long-Run Growth |
g = IR x ROIC |
-3.04% | -1.15% | Long-run growth rates of the income variable are used in the Continuing Value portion of the valuation models. |
g = %  GDP GDP |
2.50% | 2.50% | ||
| Margin from Operations | M | 6.31% | 7.95% |  |
| Depreciation/Amortization Rate | D | 32.17% | 29.14% |  |
Valuation Multiple Outcomes
The outcomes presented in this study are the result of original input data, derived data, and synthesized inputs.
Equational Form |
Observed Value |
Single-stagemultiple g solution |
Two-stage valuationmodel g solution |
|||
| 12/31/2015 | 12/31/2016 | 12/31/2015 | 12/31/2016 | 12/31/2015 | 12/31/2016 | |
|
|
0.73 | 0.67 | 2.84% | -1.97% | 3.04% | 0.10% |
|
|
7.87 | 5.95 | 2.84% | -1.97% | 3.04% | 0.10% |
|
|
17.84 | 12.92 | 2.84% | -1.97% | 3.04% | 0.10% |
|
|
11.89 | 12.42 | 2.84% | -1.97% | 3.04% | 0.10% |
|
|
11.59 | 8.39 | 2.84% | -1.97% | 3.04% | 0.10% |
|
|
1.95 | 1.85 | 2.84% | -1.97% | 3.04% | 0.10% |


