Medtronic Plc
Analyst Listing
The following analysts provide coverage for the subject firm as of May 2016:
| Broker | Analyst | Analyst Email |
| William Blair | Ben Andrew | bandrew@williamblair.com |
| Piper Jaffray | Brooks E. West | brooks.e.west@pjc.com |
| SunTrust Robinson Humphrey | Bruce Nudell | bruce.nudell@suntrust.com |
| Leerink Partners | Danielle Antalffy | danielle.antalffy@leerink.com |
| RBC Capital Markets | Glenn Novarro | glenn.novarro@rbccm.com |
| BMO Capital Markets | Joanne K. Wuensch | joanne.wuensch@bmo.com |
| Cowen & Company | Joshua Jennings | josh.jennings@cowen.com |
| Deutsche Bank Research | Kristen Stewart | kristen.stewart@db.com |
| Wells Fargo Securities | Larry Biegelsen | lawrence.biegelsen@wellsfargo.com |
| Credit Suisse | Matthew Keeler | matthew.keeler@credit-suisse.com |
| Needham | Mike Matson | mmatson@needhamco.com |
| Jefferies | Raj Denhoy | rdenhoy@jefferies.com |
| Stifel Nicolaus | Rick Wise | wiser@stifel.com |
| BTIG | Sean Lavin | slavin@btig.com |
| Oppenheimer | Steven Lichtman | steven.lichtman@opco.com |
| Wedbush Securities | Tao Levy | tao.levy@wedbush.com |
| Evercore ISI | Vijay Kumar | vijay.kumar@evercoreisi.com |
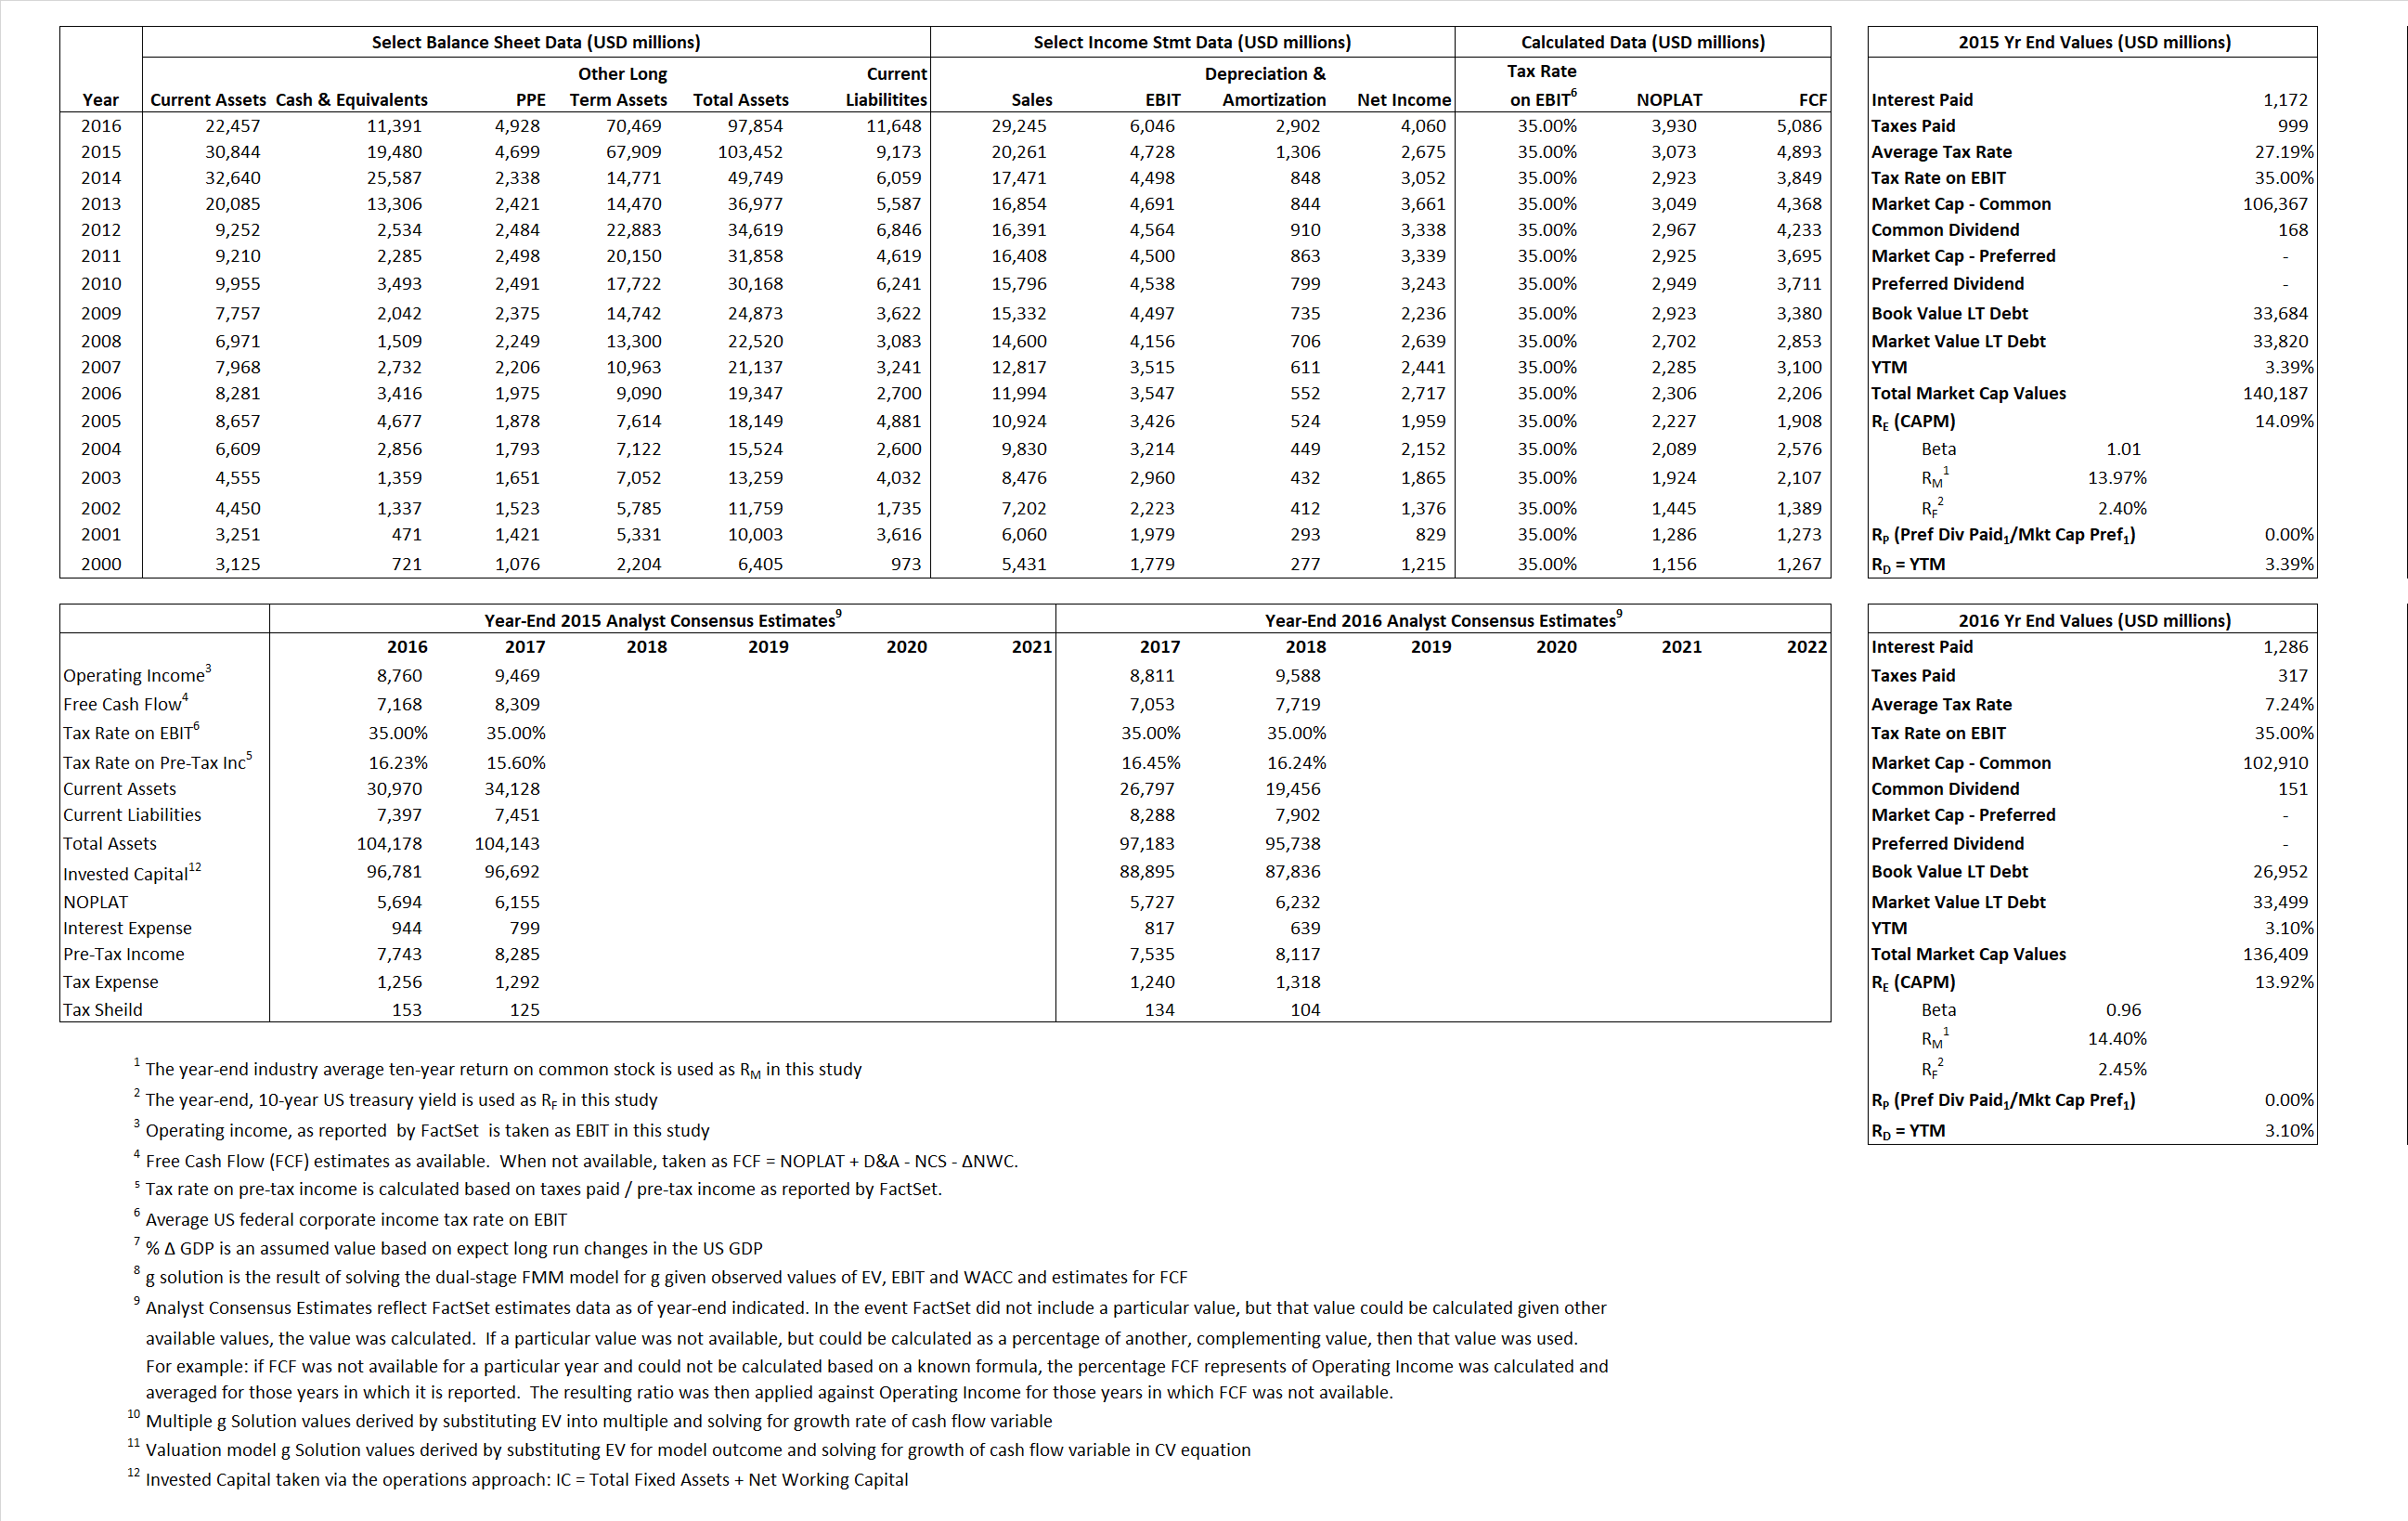
Primary Input Data
Derived Input Data
Derived Input |
Label |
2015 Value |
2016
|
Equational Form |
| Net Operating Profit Less Adjusted Taxes | NOPLAT | 3,073 | 3,930 |  |
| Free Cash Flow | FCF | 4,893 | 5,086 |  |
| Tax Shield | TS | 319 | 93 |  |
| Invested Capital | IC | 94,279 | 86,206 |  |
| Return on Invested Capital | ROIC | 3.26% | 4.56% |  |
| Net Investment | NetInv | 51,896 | (5,171) |  |
| Investment Rate | IR | 1,688.66% | -131.59% |  |
| Weighted Average Cost of Capital |
WACCMarket | 11.28% | 11.21% |  |
| WACCBook | 7.72% | 7.37% | ||
| Enterprise value |
EVMarket | 120,707 | 125,018 |  |
| EVBook | 128,660 | 118,471 | ||
| Long-Run Growth |
g = IR x ROIC |
55.04% | -6.00% | Long-run growth rates of the income variable are used in the Continuing Value portion of the valuation models. |
g = %  GDP GDP |
2.50% | 2.50% | ||
| Margin from Operations | M | 23.34% | 20.67% |  |
| Depreciation/Amortization Rate | D | 21.64% | 32.43% |  |
Valuation Multiple Outcomes
The outcomes presented in this study are the result of original input data, derived data, and synthesized inputs.
Equational Form |
Observed Value |
Single-stagemultiple g solution |
Two-stage valuationmodel g solution |
|||
| 12/31/2015 | 12/31/2016 | 12/31/2015 | 12/31/2016 | 12/31/2015 | 12/31/2016 | |
|
|
5.96 | 4.27 | 39.91% | 25.98% | 30.72% | 19.59% |
|
|
20.00 | 13.97 | 39.91% | 25.98% | 30.72% | 19.59% |
|
|
39.28 | 31.81 | 39.91% | 25.98% | 30.72% | 19.59% |
|
|
24.67 | 24.58 | 39.91% | 25.98% | 30.72% | 19.59% |
|
|
35.53 | 20.68 | 39.91% | 25.98% | 30.72% | 19.59% |
|
|
1.28 | 1.45 | 39.91% | 25.98% | 30.72% | 19.59% |


