General Motors Company
Analyst Listing
The following analysts provide coverage for the subject firm as of May 2016:
| Broker | Analyst | Analyst Email |
| Buckingham Research | Joseph C. Amaturo | jamaturo@buckresearch.com |
| Susquehanna Financial Group | Matthew T. Stover | matthew.stover@sig.com |
| Deutsche Bank Research | Rod Lache | rod.lache@db.com |
| Evercore ISI | George Galliers | george.galliers@evercoreisi.com |
| RBC Capital Markets | Joseph Spak | joseph.spak@rbccm.com |
| CRT Capital Group | Michael Ward | mward@sterneageecrt.com |
| Craig Hallum Capital Group | Steve L. Dyer | sdyer@craig-hallum.com |
| Daiwa Securities Co. Ltd. | Jairam Nathan | jairam.nathan@us.daiwacm.com |
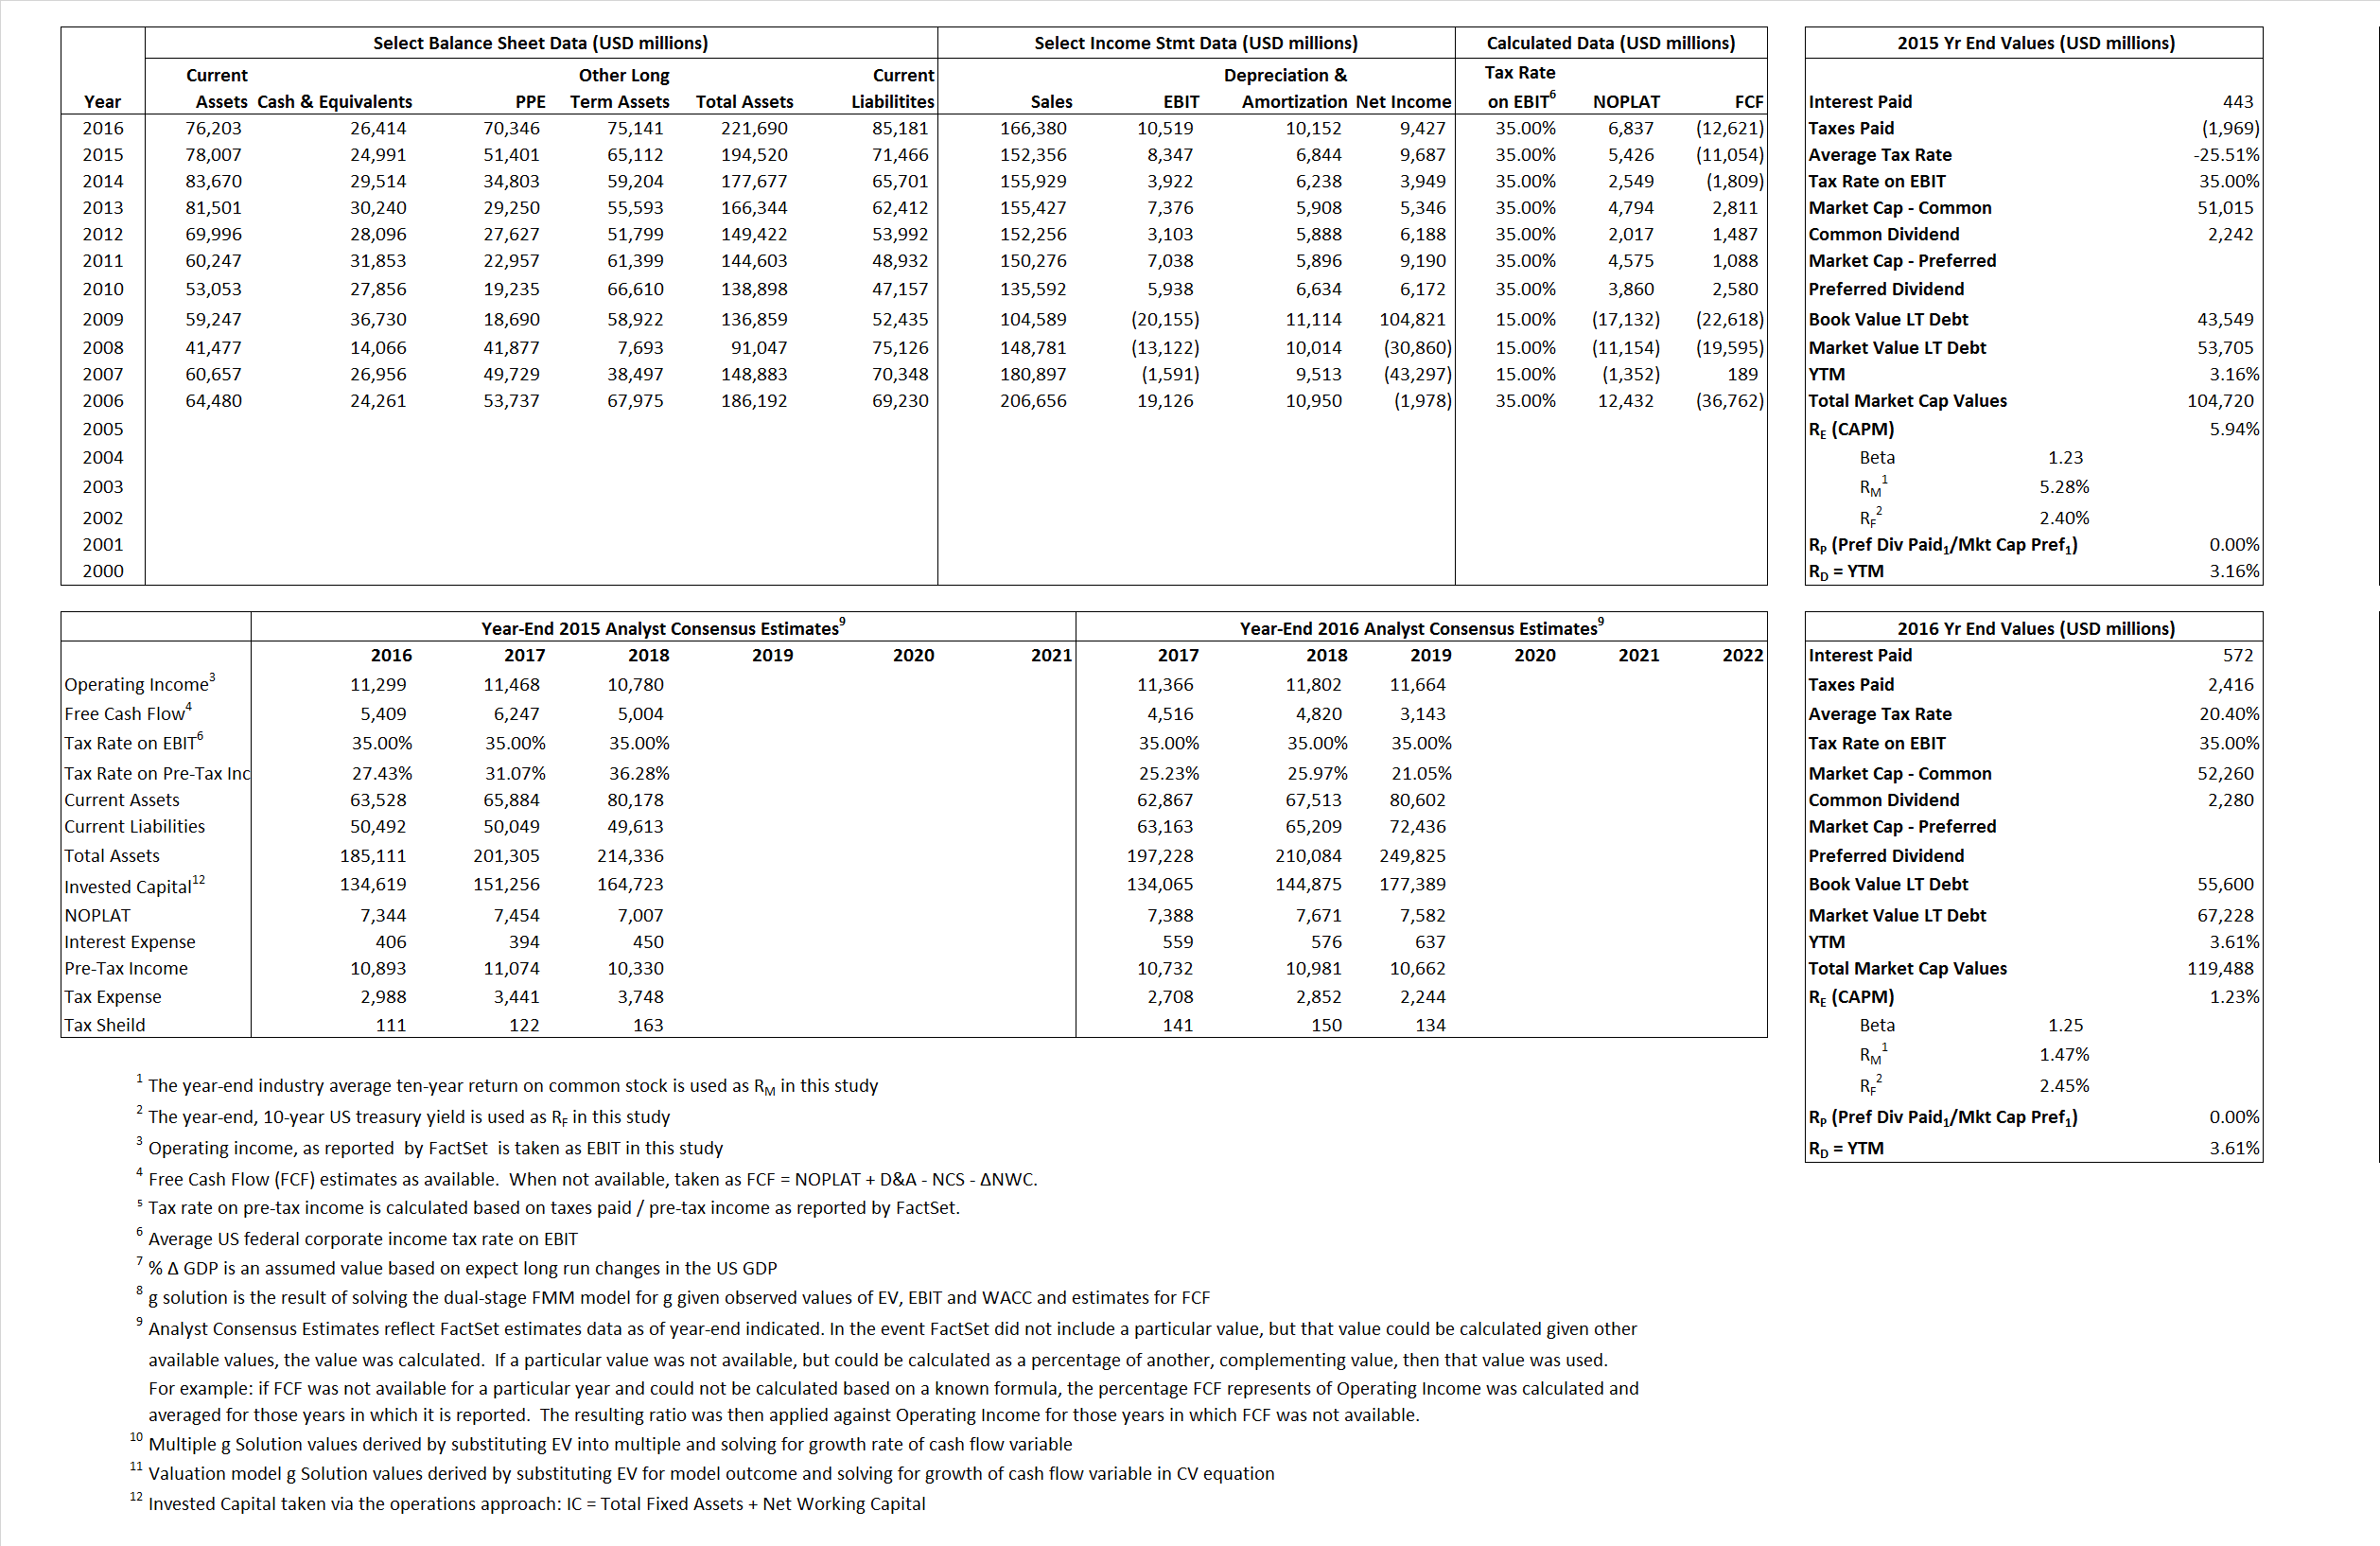
Primary Input Data
Derived Input Data
Derived Input |
Label |
2015 Value |
2016
|
Equational Form |
| Net Operating Profit Less Adjusted Taxes | NOPLAT | 5,426 | 6,837 |  |
| Free Cash Flow | FCF | (11,054) | (12,621) |  |
| Tax Shield | TS | (113) | 117 |  |
| Invested Capital | IC | 123,054 | 136,509 |  |
| Return on Invested Capital | ROIC | 4.41% | 5.01% |  |
| Net Investment | NetInv | 17,922 | 23,607 |  |
| Investment Rate | IR | 330.33% | 345.27% |  |
| Weighted Average Cost of Capital |
WACCMarket | 4.93% | 2.15% |  |
| WACCBook | 6.55% | 5.52% | ||
| Enterprise value |
EVMarket | 79,729 | 93,074 |  |
| EVBook | 69,573 | 81,443 | ||
| Long-Run Growth |
g = IR x ROIC |
14.56% | 17.29% | Long-run growth rates of the income variable are used in the Continuing Value portion of the valuation models. |
g = %  GDP GDP |
2.50% | 2.50% | ||
| Margin from Operations | M | 5.48% | 6.32% |  |
| Depreciation/Amortization Rate | D | 45.05% | 49.11% |  |
Valuation Multiple Outcomes
The outcomes presented in this study are the result of original input data, derived data, and synthesized inputs.
Equational Form |
Observed Value |
Single-stagemultiple g solution |
Two-stage valuationmodel g solution |
|||
| 12/31/2015 | 12/31/2016 | 12/31/2015 | 12/31/2016 | 12/31/2015 | 12/31/2016 | |
|
|
0.52 | o.56 | 3.45% | 11.13% | 3.61% | 12.61% |
|
|
5.25 | 4.50 | 3.45% | 11.13% | 3.61% | 12.61% |
|
|
14.70 | 13.61 | 3.45% | 11.13% | 3.61% | 12.61% |
|
|
-7.21 | -7.37 | 3.45% | 11.13% | 3.61% | 12.61% |
|
|
9.55 | 8.85 | 3.45% | 11.13% | 3.61% | 12.61% |
|
|
0.65 | 0.68 | 3.45% | 11.13% | 3.61% | 12.61% |


