Emerson Eletric Co.
Analyst Listing
The following analysts provide coverage for the subject firm as of May 2016:
| Broker | Analyst | Analyst Email |
| Langenberg, LLC | Brian K. Langenberg | brian@langenberg-llc.com |
| Oppenheimer | Christopher glynn | christopher.glynn@opco.com |
| RBC Capital Markets | Deane M. Dray | deane.dray@rbccm.com |
| Longbow Research | Eli Lustgarten | elustgarten@longbowresearch.com |
| Cowen & Company | Gautam Khanna | gautam.khanna@cowen.com |
| Deutsche Bank Research | john g. Inch | john.inch@db.com |
| CRT Capital Group | Josh W. Sullivan | jwsullivan@sterneageecrt.com |
| Buckingham Research | Joshua Pokrzywinski | jpokrzywinski@buckresearch.com |
| Credit Suisse | Julian Mitchell | julian.mitchell@credit-suisse.com |
| William Blair | Nicholas P. Heymann | nheymann@williamblair.com |
| Wells Fargo Securities | Richard M. Kwas | rich.kwas@wellsfargo.com |
| Atlantic Equities | Richard Radbourne | r.radbourne@atlantic-equities.com |
| Stifel Nicolaus | Robert P. McCarthy | mccarthyr@stifel.com |
| Bernstein Research | Steven E. winoker | steven.winoker@bernstein.com |
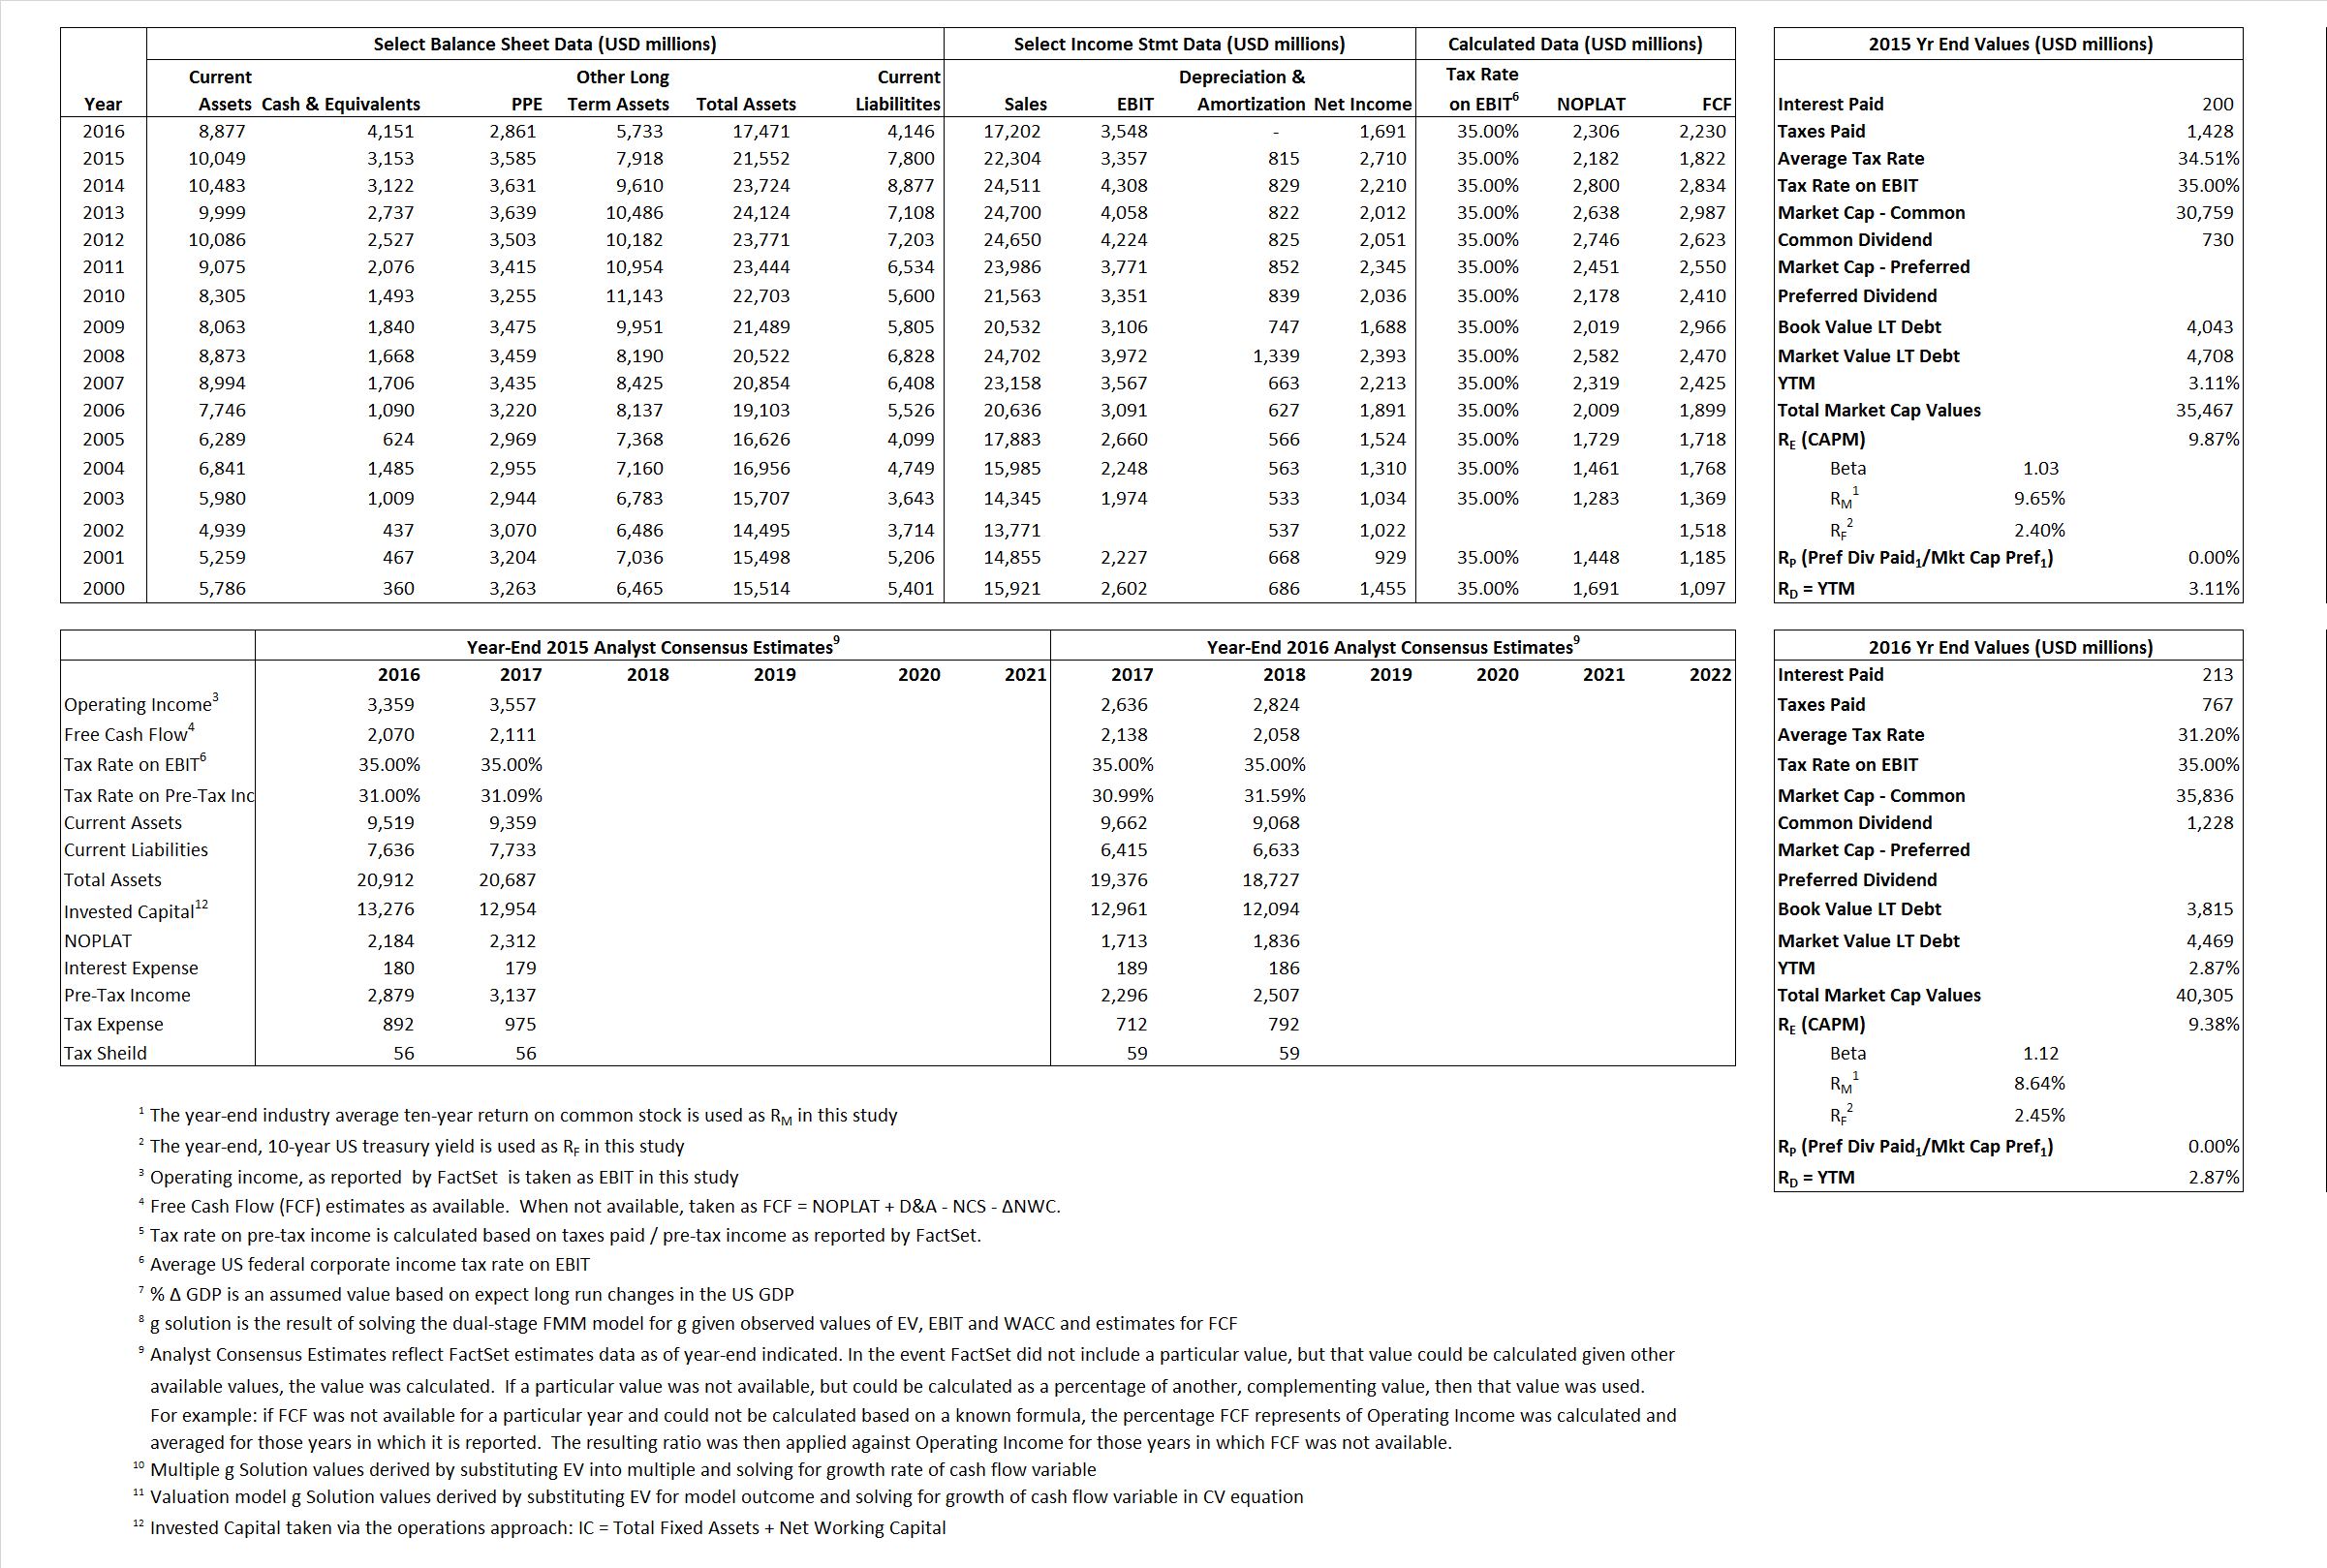
Primary Input Data
Derived Input Data
Derived Input |
Label |
2015 Value |
2016
|
Equational Form |
| Net Operating Profit Less Adjusted Taxes | NOPLAT | 2,182 | 2,306 |  |
| Free Cash Flow | FCF | 1,822 | 2,230 |  |
| Tax Shield | TS | 69 | 66 |  |
| Invested Capital | IC | 13,752 | 13,325 |  |
| Return on Invested Capital | ROIC | 15.87% | 17.31% |  |
| Net Investment | NetInv | (280) | (427) |  |
| Investment Rate | IR | -12.83% | -18.52% |  |
| Weighted Average Cost of Capital |
WACCMarket | 8.83% | 8.56% |  |
| WACCBook | 8.62% | 9.09% | ||
| Enterprise value |
EVMarket | 32,314 | 36,154 |  |
| EVBook | 31,649 | 35,500 | ||
| Long-Run Growth |
g = IR x ROIC |
-2.04% | -3.20% | Long-run growth rates of the income variable are used in the Continuing Value portion of the valuation models. |
g = %  GDP GDP |
2.50% | 2.50% | ||
| Margin from Operations | M | 15.05% | 20.63% |  |
| Depreciation/Amortization Rate | D | 19.53% | 0.00% |  |
Valuation Multiple Outcomes
The outcomes presented in this study are the result of original input data, derived data, and synthesized inputs.
Equational Form |
Observed Value |
Single-stagemultiple g solution |
Two-stage valuationmodel g solution |
|||
| 12/31/2015 | 12/31/2016 | 12/31/2015 | 12/31/2016 | 12/31/2015 | 12/31/2016 | |
|
|
1.45 | 2.10 | 3.61% | 3.46% | 4.03% | 4.58% |
|
|
7.75 | 10.19 | 3.61% | 3.46% | 4.03% | 4.58% |
|
|
14.81 | 15.68 | 3.61% | 3.46% | 4.03% | 4.58% |
|
|
17.74 | 16.21 | 3.61% | 3.46% | 4.03% | 4.58% |
|
|
9.63 | 10.19 | 3.61% | 3.46% | 4.03% | 4.58% |
|
|
2.35 | 2.71 | 3.61% | 3.46% | 4.03% | 4.58% |


