Duke Energy
Analyst Listing
The following analysts provide coverage for the subject firm as of May 2016:
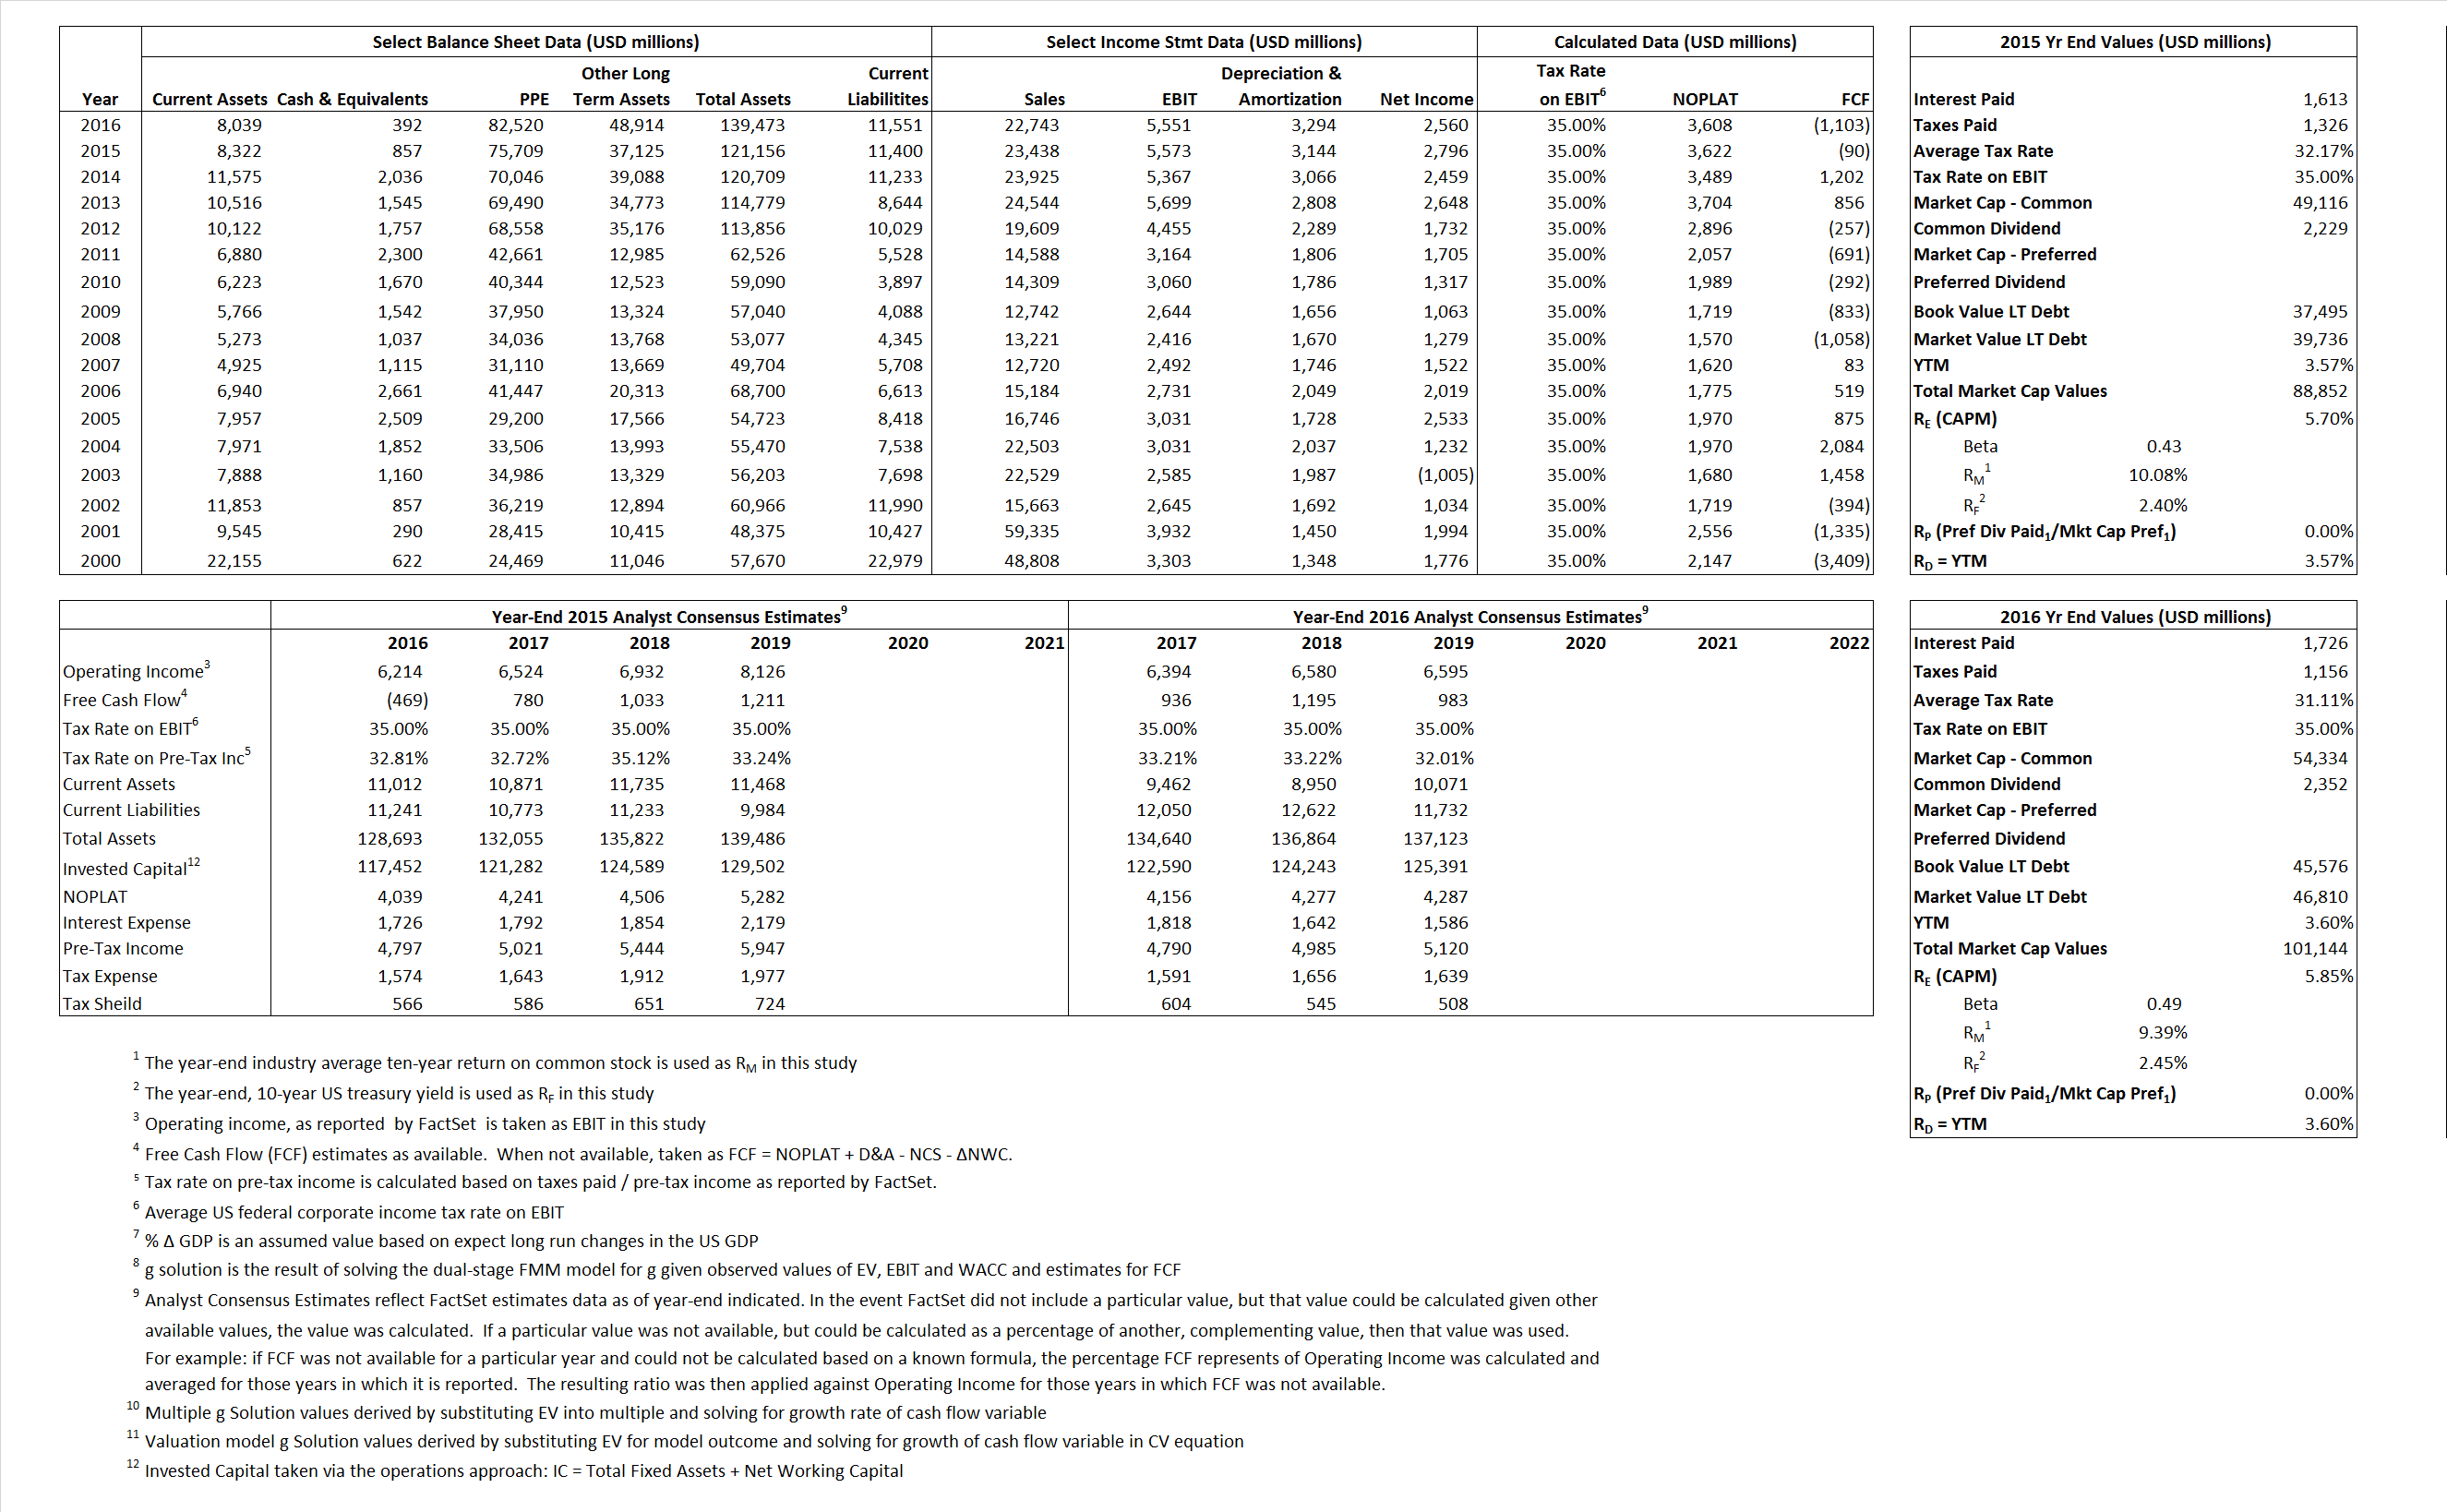
Primary Input Data
Derived Input Data
Derived Input |
Label |
2015 Value |
2016
|
Equational Form |
| Net Operating Profit Less Adjusted Taxes | NOPLAT | 3,622 | 3,608 |  |
| Free Cash Flow | FCF | (90) | (1,103) |  |
| Tax Shield | TS | 519 | 537 |  |
| Invested Capital | IC | 109,756 | 127,922 |  |
| Return on Invested Capital | ROIC | 3.30% | 2.82% |  |
| Net Investment | NetInv | 3,424 | 21,460 |  |
| Investment Rate | IR | 94.52% | 594.76% |  |
| Weighted Average Cost of Capital |
WACCMarket | 4.24% | 4.29% |  |
| WACCBook | 3.76% | 3.92% | ||
| Enterprise value |
EVMarket | 87,995 | 100,752 |  |
| EVBook | 85,754 | 99,518 | ||
| Long-Run Growth |
g = IR x ROIC |
3.12% | 16.78% | Long-run growth rates of the income variable are used in the Continuing Value portion of the valuation models. |
g = %  GDP GDP |
2.50% | 2.50% | ||
| Margin from Operations | M | 23.78% | 24.41% |  |
| Depreciation/Amortization Rate | D | 36.07% | 37.24% |  |
Valuation Multiple Outcomes
The outcomes presented in this study are the result of original input data, derived data, and synthesized inputs.
Equational Form |
Observed Value |
Single-stagemultiple g solution |
Two-stage valuationmodel g solution |
|||
| 12/31/2015 | 12/31/2016 | 12/31/2015 | 12/31/2016 | 12/31/2015 | 12/31/2016 | |
|
|
3.75 | 4.43 | -0.48% | -2.63% | -7.86% | -9.50% |
|
|
10.09 | 11.39 | -0.48% | -2.63% | -7.86% | -9.50% |
|
|
24.29 | 27.92 | -0.48% | -2.63% | -7.86% | -9.50% |
|
|
-977.73 | -91.34 | -0.48% | -2.63% | -7.86% | -9.50% |
|
|
15.79 | 18.15 | -0.48% | -2.63% | -7.86% | -9.50% |
|
|
.80 | 0.79 | -0.48% | -2.63% | -7.86% | -9.50% |


