Freeport-Mcmoran
Analyst Listing
The following analysts provide coverage for the subject firm as of May 2016:
| Broker | Analyst | Analyst Email |
| Clarksons Platou Securities | Jeremy Sussman | jeremy.sussman@clarksons.com |
| RBC Capital Markets | Fraser Phillips | fraser.phillips@rbccm.com |
| Scotiabank GBM | Orest Wowkodaw | orest.wowkodaw@scotiabank.com |
| Deutsche Bank Research | Chris Terry | chris.terry@db.com |
| Stifel Nicolaus | Paul Massoud | pamassoud@stifel.com |
| Jefferies | Christopher LaFemina | clafemina@jefferies.com |
| BMO Capital Markets | David Gagliano | david.gagliano@bmo.com |
| FBR Capital Markets & Co | Lucas Pipes | lpipes@fbr.com |
| BB&T Capital Markets | Garrett S. Nelson | gnelson@bbandtcm.com |
| Cowen & Company | Anthony B. Rizzuto Jr. | anthony.rizzuto@cowen.com |
| Gabelli & Company | Chris Mancini | cmancini@gabelli.com |
| Berenberg | Fawzi Hanano | fawzi.hanano.@berenberg.com |
| Morningstar | Jeffrey Stafford | jeffrey.stafford@morningstar.com |
| Argus Research | William Selesky | bselesky@argusresearch.com |
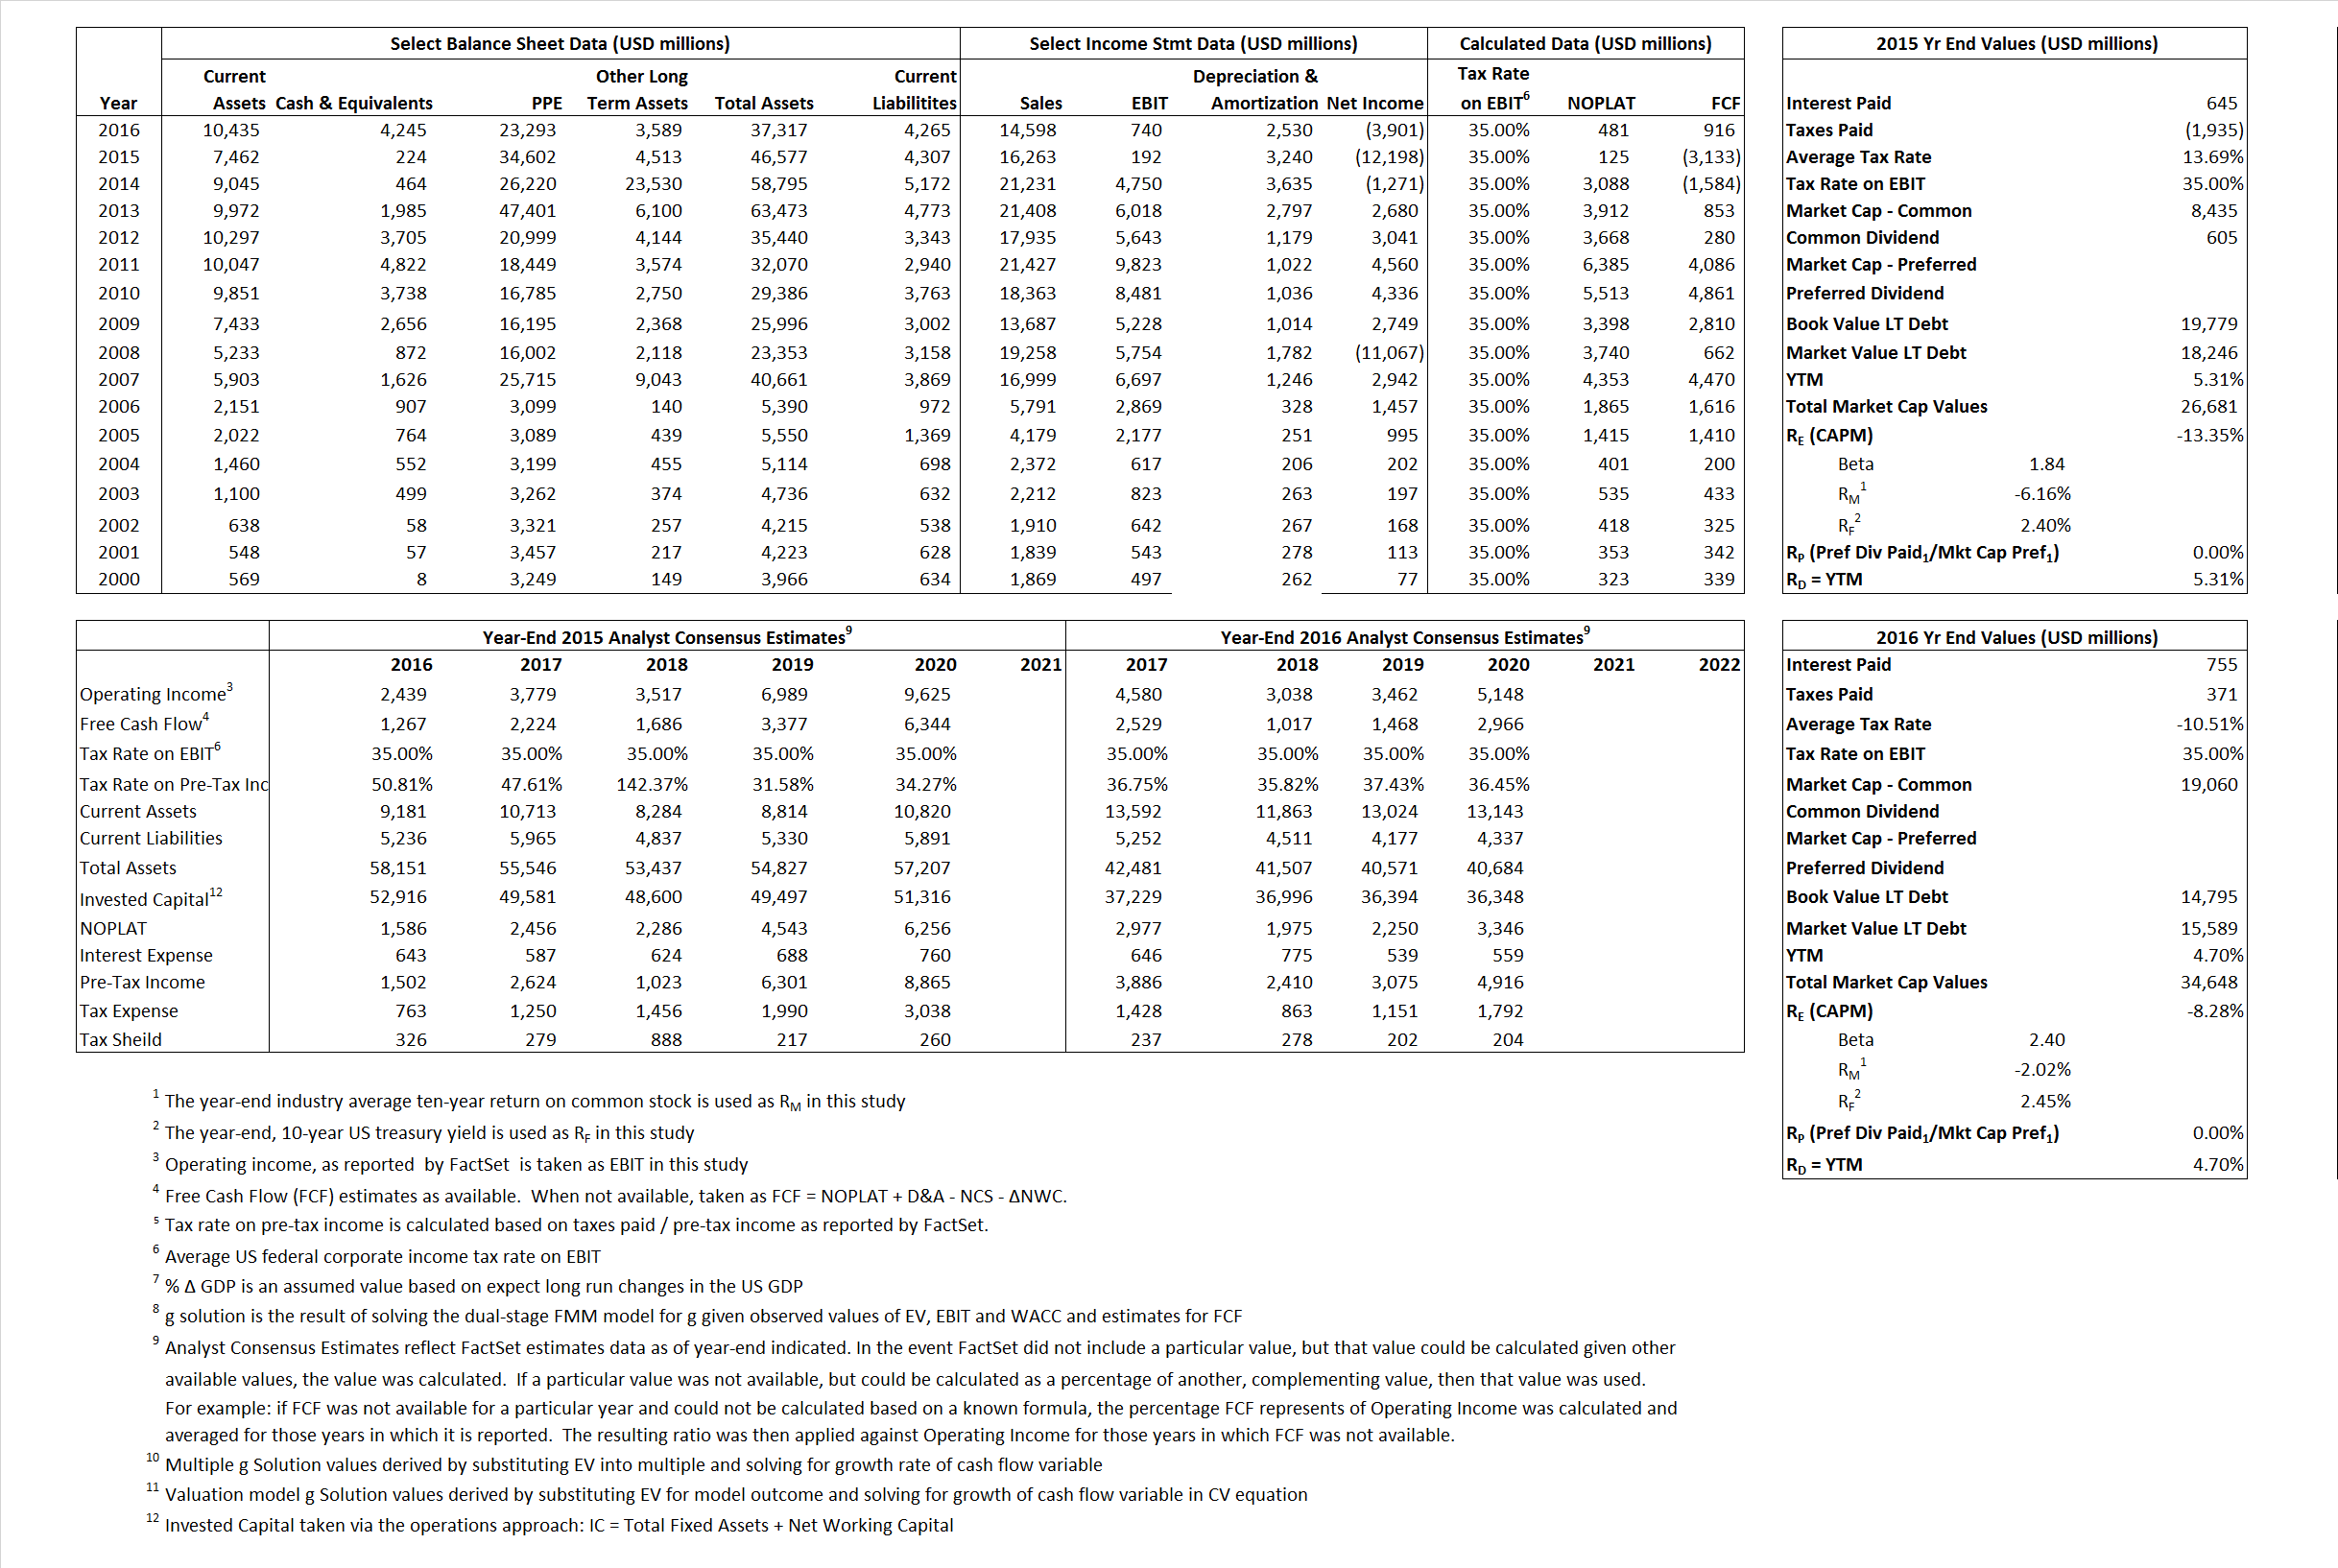
Primary Input Data
Derived Input Data
Derived Input |
Label |
2015 Value |
2016
|
Equational Form |
| Net Operating Profit Less Adjusted Taxes | NOPLAT | 125 | 481 |  |
| Free Cash Flow | FCF | (3,133) | 916 |  |
| Tax Shield | TS | 88 | (79) |  |
| Invested Capital | IC | 42,270 | 33,052 |  |
| Return on Invested Capital | ROIC | 0.30% | 1.46% |  |
| Net Investment | NetInv | (8,113) | (6,688) |  |
| Investment Rate | IR | -6,500.80% | -1,390.44% |  |
| Weighted Average Cost of Capital |
WACCMarket | -1.09% | -2.22% |  |
| WACCBook | 6.85% | 10.53% | ||
| Enterprise value |
EVMarket | 26,457 | 30,403 |  |
| EVBook | 27,990 | 29,610 | ||
| Long-Run Growth |
g = IR x ROIC |
-19.19% | -20.23% | Long-run growth rates of the income variable are used in the Continuing Value portion of the valuation models. |
g = %  GDP GDP |
2.50% | 2.50% | ||
| Margin from Operations | M | 1.18% | 5.07% |  |
| Depreciation/Amortization Rate | D | 94.41% | 77.37% |  |
Valuation Multiple Outcomes
The outcomes presented in this study are the result of original input data, derived data, and synthesized inputs.
Equational Form |
Observed Value |
Single-stagemultiple g solution |
Two-stage valuationmodel g solution |
|||
| 12/31/2015 | 12/31/2016 | 12/31/2015 | 12/31/2016 | 12/31/2015 | 12/31/2016 | |
|
|
1.63 | 2.08 | 2.61% | 43.60% | 0.74% | 20.87% |
|
|
7.71 | 9.30 | 2.61% | 43.60% | 0.74% | 20.87% |
|
|
212.00 | 63.21 | 2.61% | 43.60% | 0.74% | 20.87% |
|
|
-8.44 | 33.19 | 2.61% | 43.60% | 0.74% | 20.87% |
|
|
137.80 | 41.09 | 2.61% | 43.60% | 0.74% | 20.87% |
|
|
0.63 | 0.92 | 2.61% | 43.60% | 0.74% | 20.87% |


