Comcast Corporation Class A
Analyst Listing
The following analysts provide coverage for the subject firm as of May 2016:
| Broker | Analyst | Analyst Email |
| Pacific Crest Securities-KBCM | Andy Hargreaves | ahargreaves@pacific-crest.com |
| Nomura Research | Anthony DiClemente | anthony.diclemente@nomura.com |
| Deutsche Bank Research | Bryan Kraft | bryan.kraft@db.com |
| Raymond James | Frank G. Louthan IV | frank.louthan@raymondjames.com |
| Atlantic Equities | Hamiton Faber | h.faber@atlantic-equities.com |
| Buckingham Research | James Ratcliffe | jratcliffe@buckresearch.com |
| Scotiabank GBM | Jeffrey Fan | jeff.fan@scotiabank.com |
| Pivotal Research Group | Jeffrey Wlodarczak | jeff@pvtl.com |
| RBC Capital Markets | Jonathan Atkin | jonathan.atkin@rbccm.com |
| Wells Fargo Securities | Marci Ryvicker | marci.ryvicker@wellsfargo.com |
| Wunderlich Securities | Matthew Harrigan | mharrigan@wundernet.com |
| Guggenheim Securities | Michael C. Morris | michael.morris@guggenheimpartners.com |
| Jefferies | Mike McCormack | mmccormack@jefferies.com |
| Credit Suisse | Omar Sheikh | omar.sheikh@credit-suisse.com |
| Oppenheimer | Timothy Horan | tim.horan@opco.com |
| Evercore ISI | Vijay Jayant | vijay.jayant@evercoreisi.com |
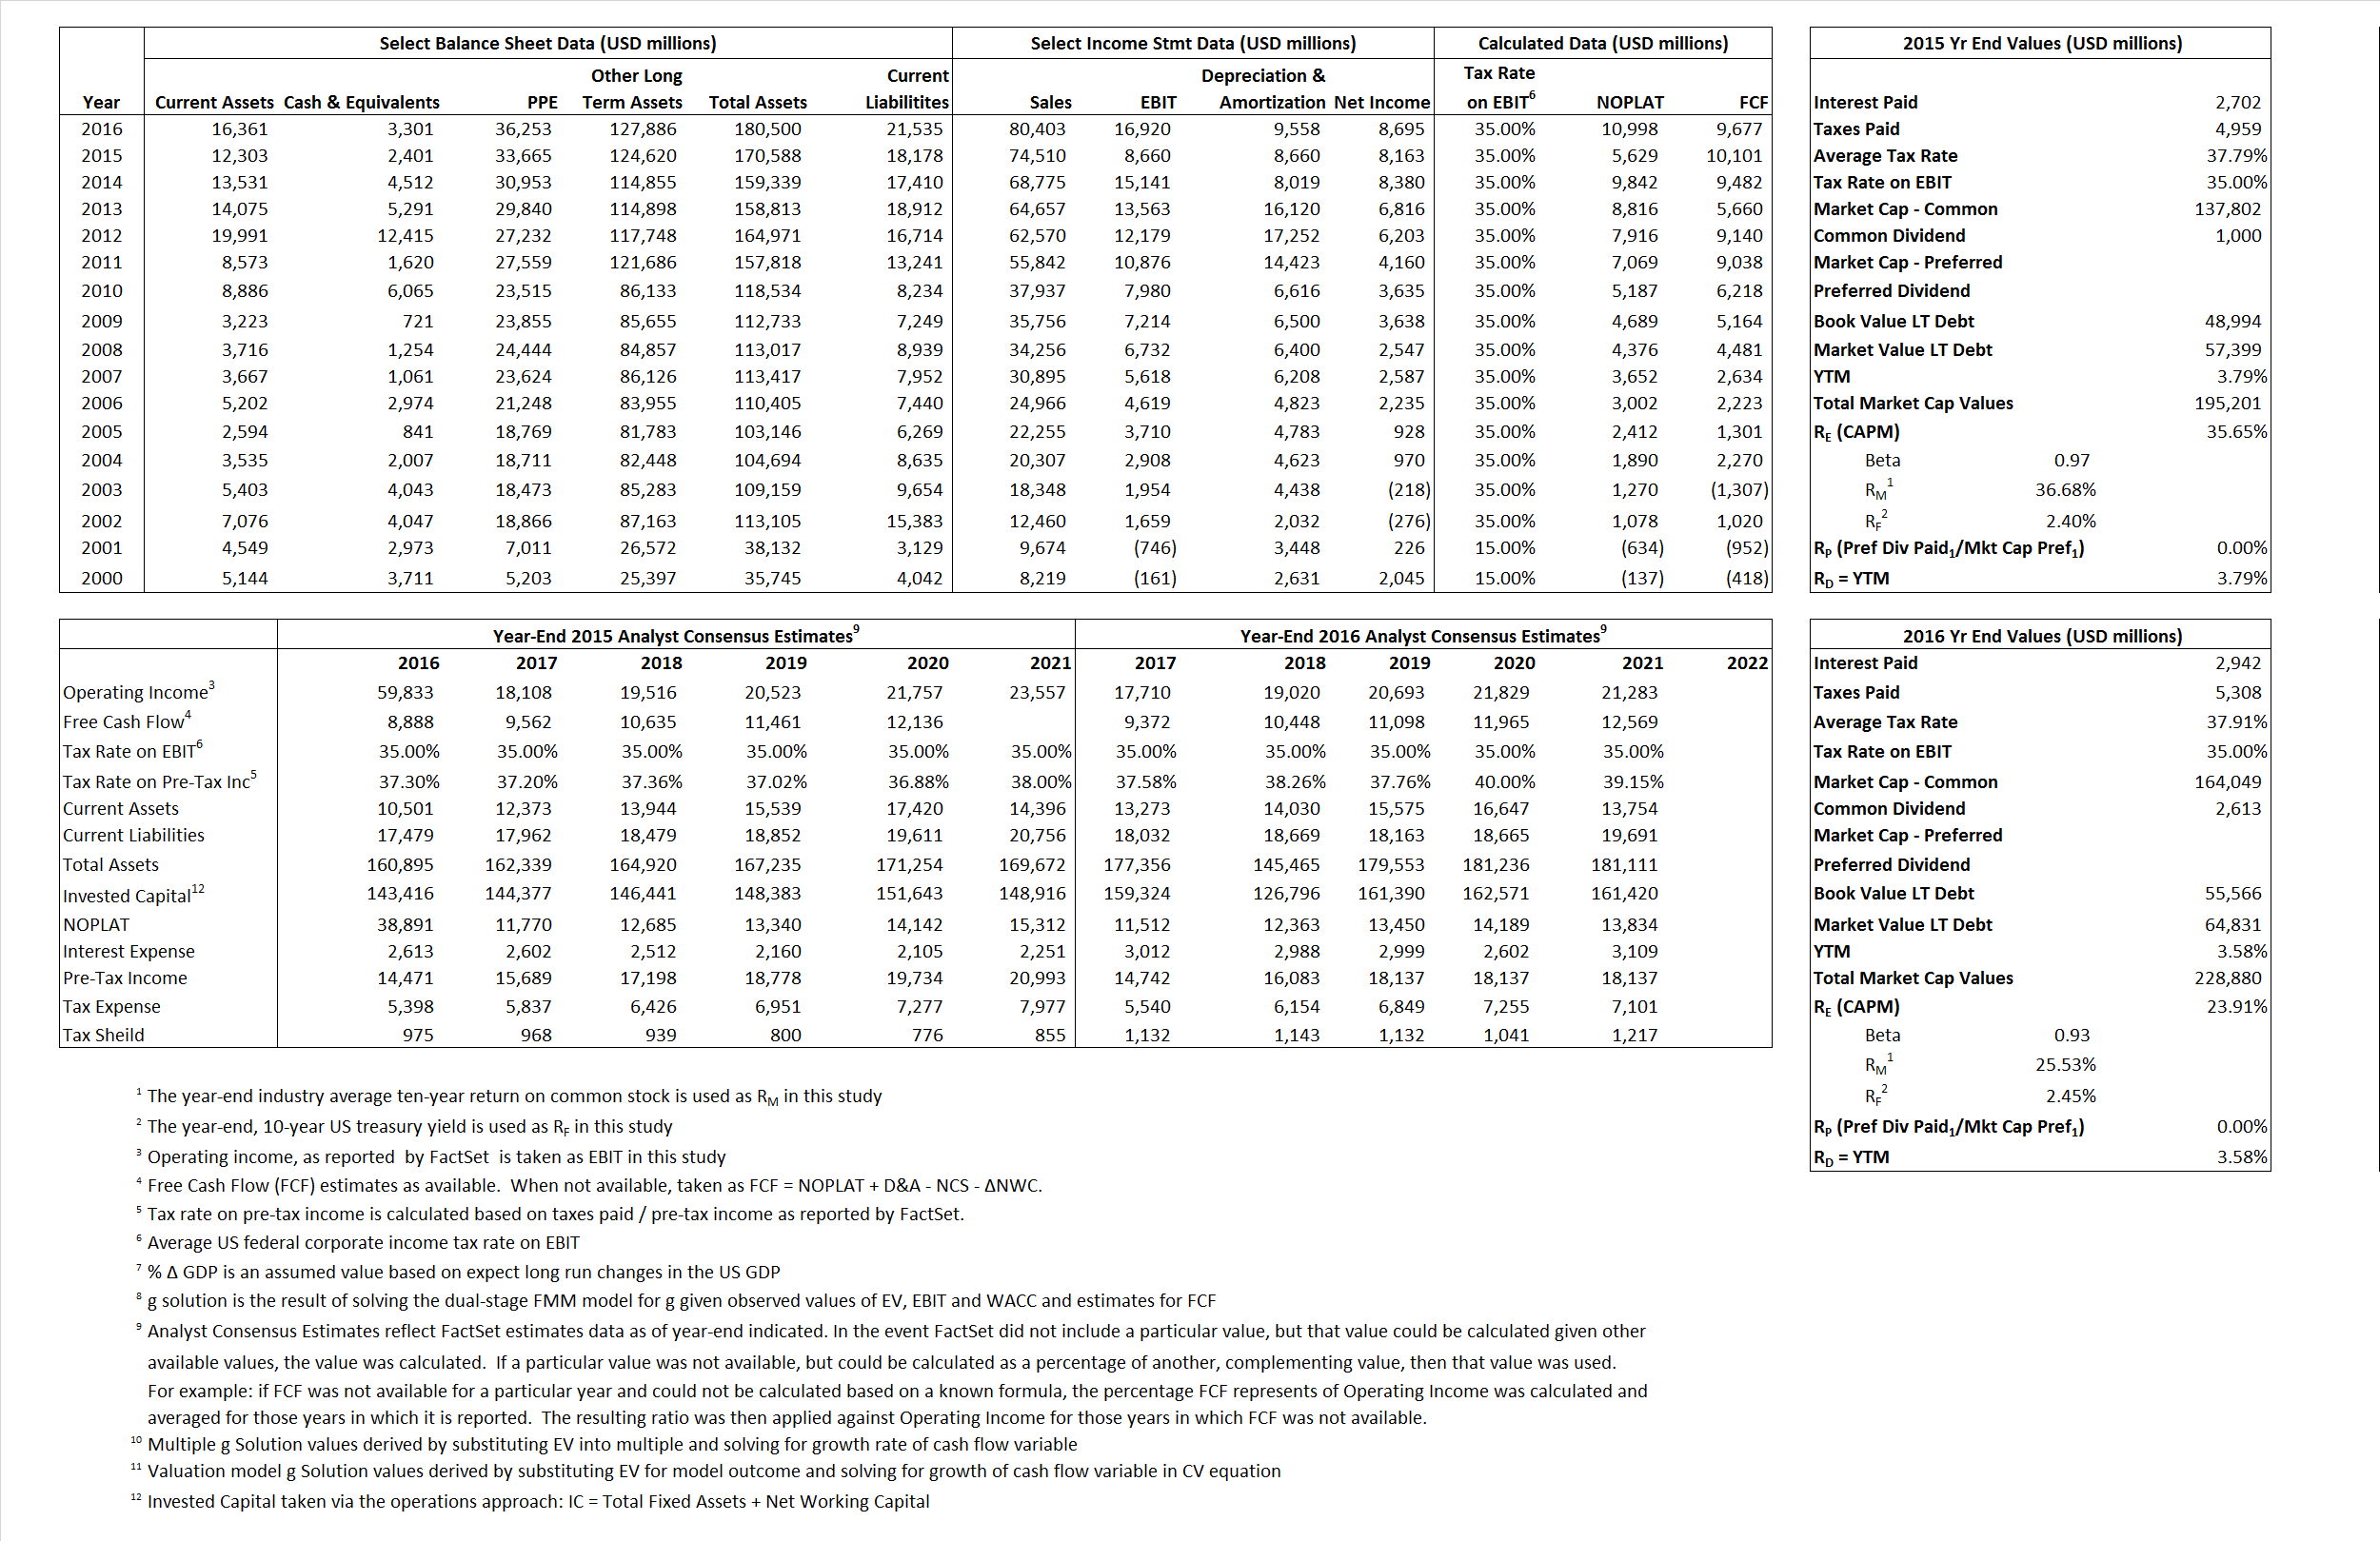
Primary Input Data
Derived Input Data
Derived Input |
Label |
2015 Value |
2016
|
Equational Form |
| Net Operating Profit Less Adjusted Taxes | NOPLAT | 5,629 | 10,998 |  |
| Free Cash Flow | FCF | 10,101 | 9,677 |  |
| Tax Shield | TS | 1,021 | 1,115 |  |
| Invested Capital | IC | 152,410 | 158,965 |  |
| Return on Invested Capital | ROIC | 3.69% | 6.92% |  |
| Net Investment | NetInv | 19,141 | 16,113 |  |
| Investment Rate | IR | 340.04% | 146.51% |  |
| Weighted Average Cost of Capital |
WACCMarket | 25.86% | 17.77% |  |
| WACCBook | 7.13% | 6.74% | ||
| Enterprise value |
EVMarket | 192,800 | 225,579 |  |
| EVBook | 184,395 | 216,314 | ||
| Long-Run Growth |
g = IR x ROIC |
12.56% | 10.14% | Long-run growth rates of the income variable are used in the Continuing Value portion of the valuation models. |
g = %  GDP GDP |
2.50% | 2.50% | ||
| Margin from Operations | M | 11.62% | 21.04% |  |
| Depreciation/Amortization Rate | D | 50.00% | 36.10% |  |
Valuation Multiple Outcomes
The outcomes presented in this study are the result of original input data, derived data, and synthesized inputs.
Equational Form |
Observed Value |
Single-stagemultiple g solution |
Two-stage valuationmodel g solution |
|||
| 12/31/2015 | 12/31/2016 | 12/31/2015 | 12/31/2016 | 12/31/2015 | 12/31/2016 | |
|
|
2.59 | 2.81 | 109.51% | 43.67% | 34.95% | 22.67% |
|
|
11.13 | 8.52 | 109.51% | 43.67% | 34.95% | 22.67% |
|
|
34.25 | 20.51 | 109.51% | 43.67% | 34.95% | 22.67% |
|
|
19.09 | 23.31 | 109.51% | 43.67% | 34.95% | 22.67% |
|
|
22.26 | 13.33 | 109.51% | 43.67% | 34.95% | 22.67% |
|
|
1.27 | 1.42 | 109.51% | 43.67% | 34.95% | 22.67% |


