Texas Instruments
Analyst Listing
The following analysts provide coverage for the subject firm as of May 2016:
| Broker | Analyst | Analyst Email |
| BMO Capital Markets | Ambrish Srivastava | ambrish.srivastava@bmo.com |
| RBC Capital Markets | Amit Daryanani | amit.daryanani@rbccm.com |
| Wedbush Securities | Betsy Van Hees | betsy.vanhees@wedbush.com |
| Evercore ISI | C.J. Muse | cj.muse@evercoreisi.com |
| Drexel Hamilton | Cody Acree | cacree@drexelhamilton.com |
| B Riley & Co | Craig A. Ellis | cellis@brileyco.com |
| Wells Fargo Securities | David Wong | david.m.wong@wellsfargo.com |
| CRT Capital Group | Douglas Freedman | dfreedman@sterneageecrt.com |
| Raymond James | J. Steven Smigie | steve.smigie@raymondjames.com |
| Credit Suisse | John Pitzer | john.pitzer@credit-suisse.com |
| Jefferies | Mark Lipacis | mlipacis@jefferies.com |
| Pacific Crest Securities-KBCM | Michael McConnell | mmcconnell@pacific-crest.com |
| Oppenheimer | Rick Schafer | rick.schafer@opco.com |
| Nomura Research | Romit Shah | romit.shah@nomura.com |
| Deutsche Bank Research | Ross Seymore | ross.seymore@db.com |
| Bernstein Research | Stacy A. Rasgon | stacy.rasgon@bernstein.com |
| Cowen & Company | Timothy Arcuri | timothy.arcuri@cowen.com |
| Stifel Nicolaus | Tore Svanberg | tsvanberg@stifel.com |
| Mizuho Securities USA | Vijay Rakesh | vijay.rakesh@us.mizuho-sc.com |
| SunTrust Robinson Humphrey | William Stein | william.stein@suntrust.com |
| Daiwa Securities Co. Ltd. | Yoko Yamada | yoko.yamada@us.daiwacm.com |
Primary Input Data
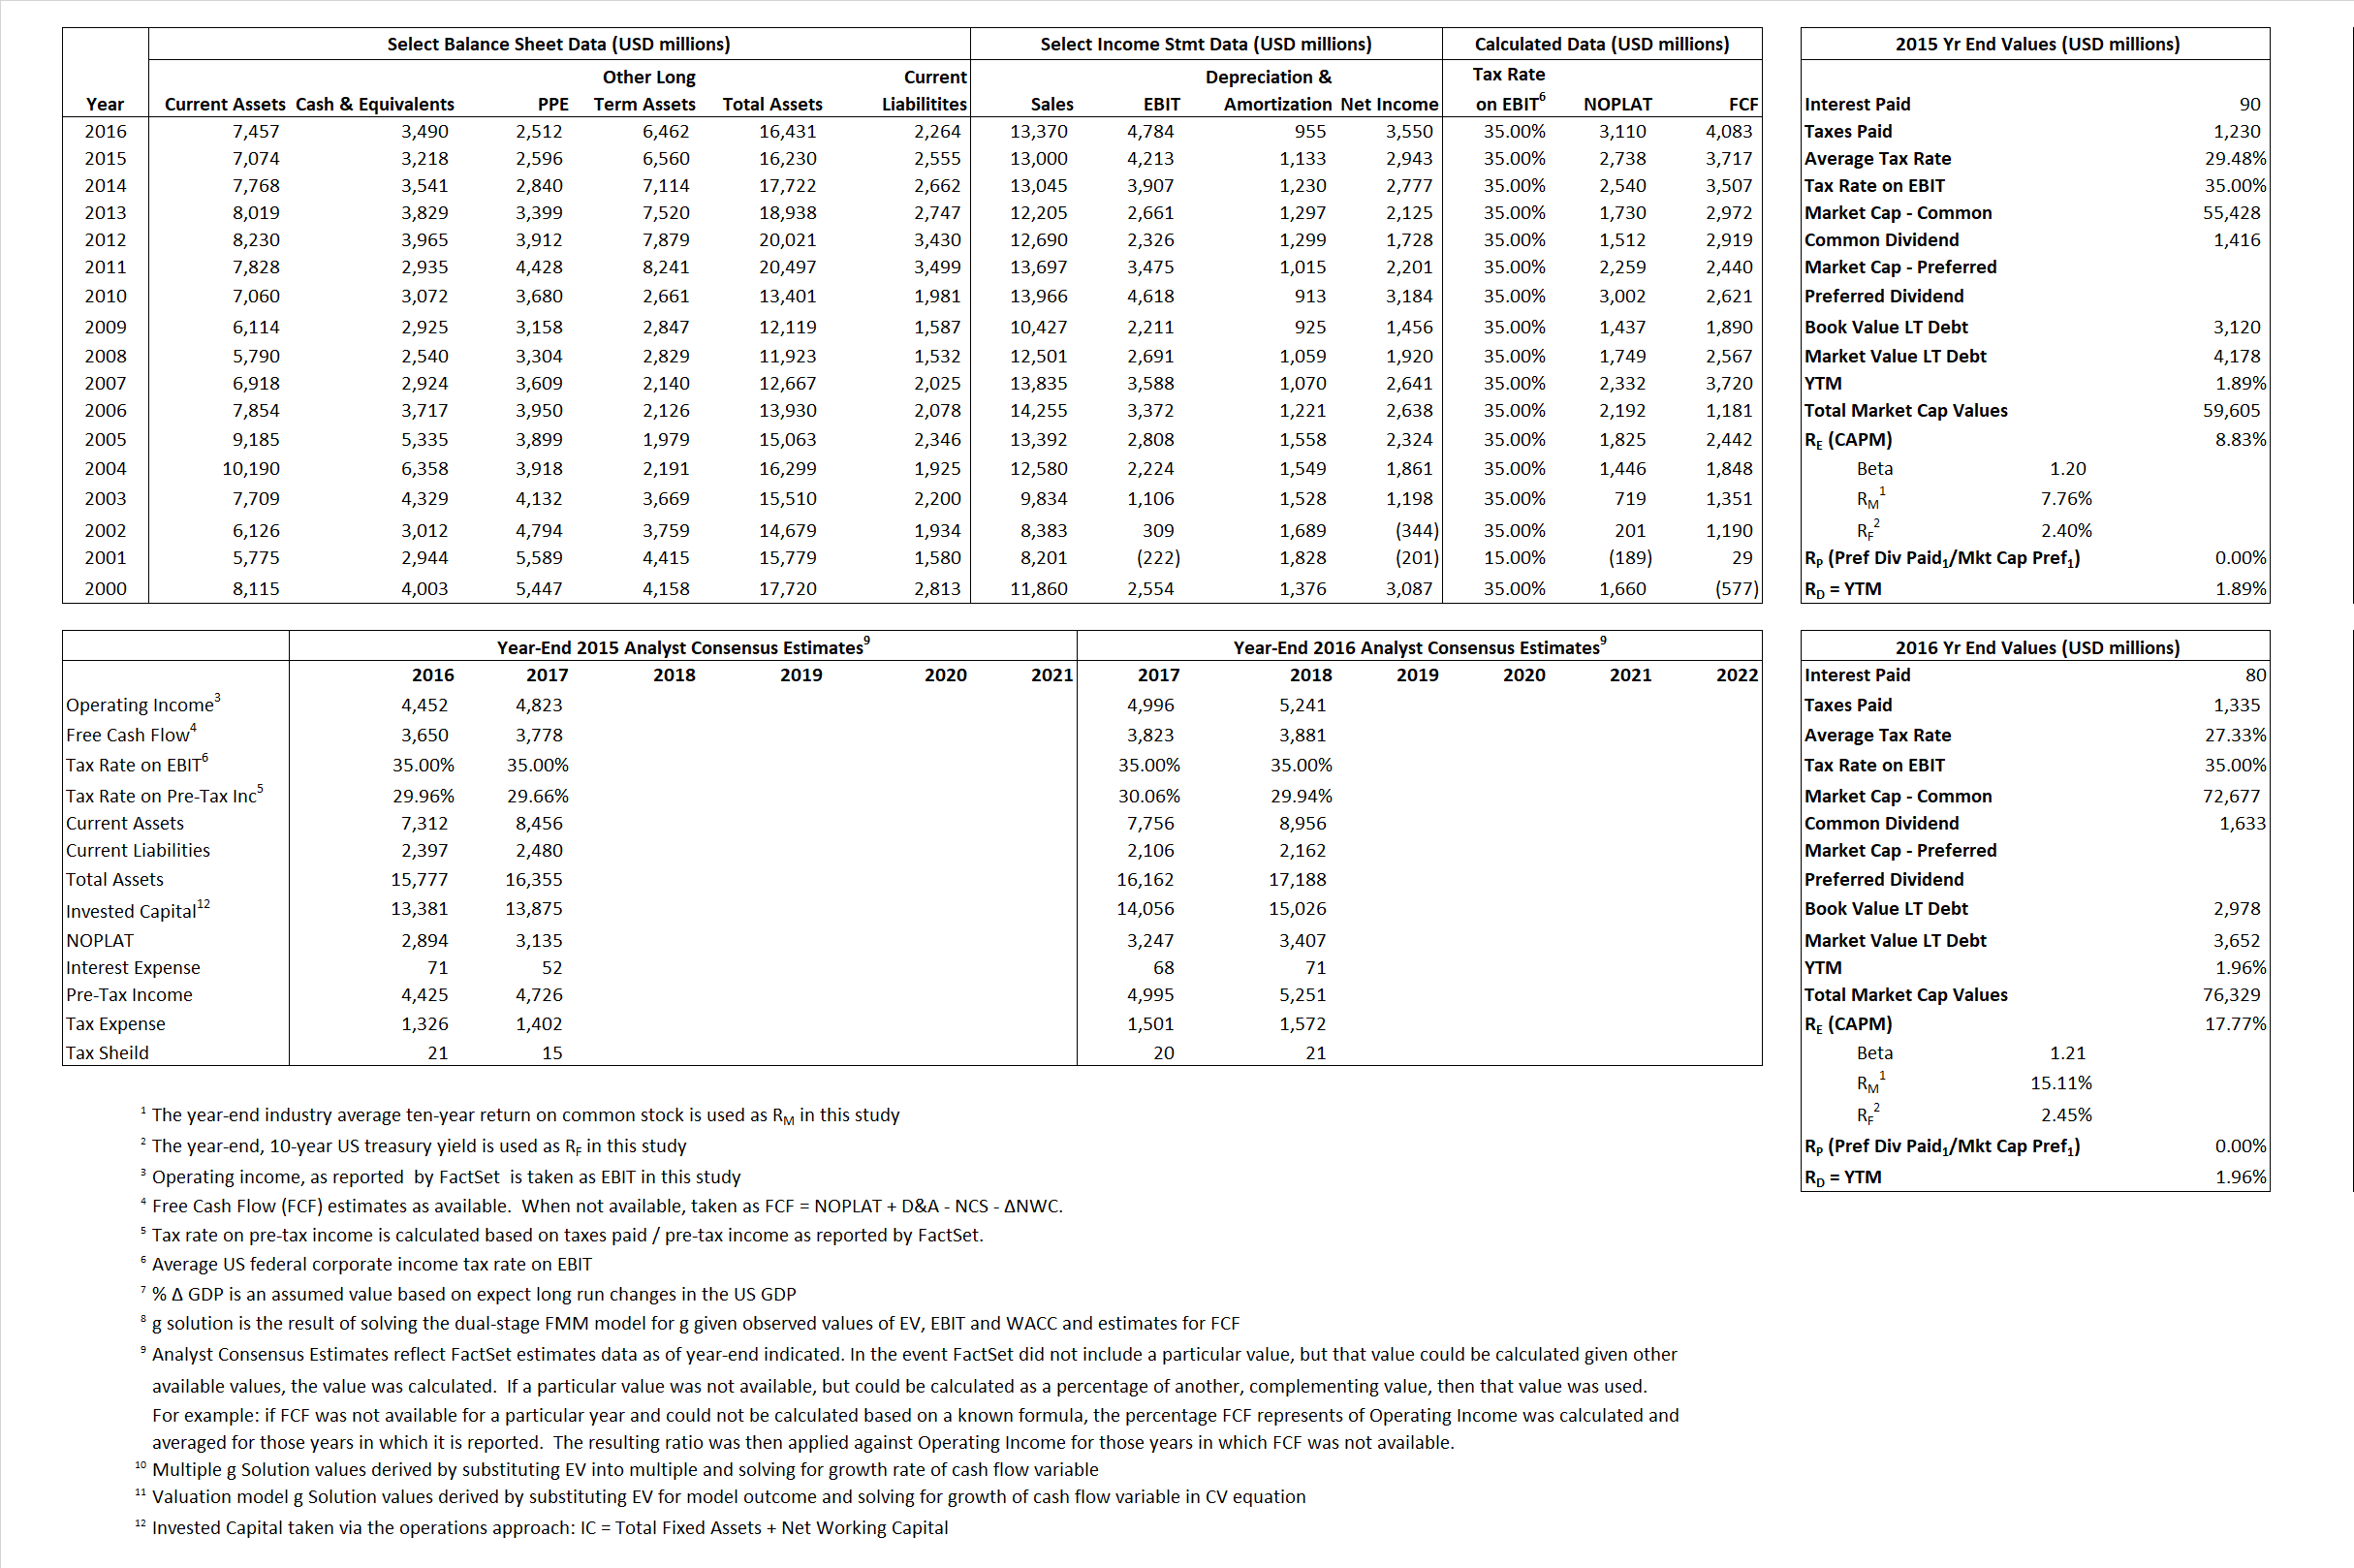
Derived Input Data
Derived Input |
Label |
2015 Value |
2016
|
Equational Form |
| Net Operating Profit Less Adjusted Taxes | NOPLAT | 2,738 | 3,110 |  |
| Free Cash Flow | FCF | 3,717 | 4,083 |  |
| Tax Shield | TS | 27 | 22 |  |
| Invested Capital | IC | 13,675 | 14,167 |  |
| Return on Invested Capital | ROIC | 20.03% | 21.95% |  |
| Net Investment | NetInv | (252) | 1,447 |  |
| Investment Rate | IR | -9.20% | 46.53% |  |
| Weighted Average Cost of Capital |
WACCMarket | 8.31% | 16.99% |  |
| WACCBook | 10.21% | 9.95% | ||
| Enterprise value |
EVMarket | 56,387 | 72,839 |  |
| EVBook | 55,058 | 72,165 | ||
| Long-Run Growth |
g = IR x ROIC |
-1.84% | 10.21% | Long-run growth rates of the income variable are used in the Continuing Value portion of the valuation models. |
g = %  GDP GDP |
2.50% | 2.50% | ||
| Margin from Operations | M | 32.41% | 35.78% |  |
| Depreciation/Amortization Rate | D | 21.19% | 16.64% |  |
Valuation Multiple Outcomes
The outcomes presented in this study are the result of original input data, derived data, and synthesized inputs.
Equational Form |
Observed Value |
Single-stagemultiple g solution |
Two-stage valuationmodel g solution |
|||
| 12/31/2015 | 12/31/2016 | 12/31/2015 | 12/31/2016 | 12/31/2015 | 12/31/2016 | |
|
|
4.34 | 5.45 | 4.55% | 15.79% | 4.72% | 16.16% |
|
|
10.55 | 12.69 | 4.55% | 15.79% | 4.72% | 16.16% |
|
|
20.59 | 23.42 | 4.55% | 15.79% | 4.72% | 16.16% |
|
|
15.17 | 17.84 | 4.55% | 15.79% | 4.72% | 16.16% |
|
|
13.38 | 15.23 | 4.55% | 15.79% | 4.72% | 16.16% |
|
|
4.12 | 5.14 | 4.55% | 15.79% | 4.72% | 16.16% |


