Allstate
Analyst Listing
The following analysts provide coverage for the subject firm as of May 2016:
| Broker | Analyst | Analyst Email |
| William Blair | Adam Klauber | aklauber@williamblair.com |
| Morningstar | Brett Horn | brett.horn@morningstar.com |
| Raymond James | C. Gregory Peters | greg.peters@raymondjames.com |
| Piper Jaffray | Daniel D. Farrell | daniel.d.farrell@pjc.com |
| Wells Fargo Securities | Elyse Greenspan | elyse.greenspan@wellsfargo.com |
| Dowling & Partners | Gary Ransom | ransom@dowling.com |
| Argus Research | Jacob Kilstein | jkilstein@argusresearch.com |
| Bernstein Research | Josh Stirling | josh.stirling@bernstein.com |
| Deutsche Bank Research | Joshua Shanker | joshua.shanker@db.com |
| Compass Point Research | Ken Billingsley | kbillingsley@compasspointllc.com |
| RBC Capital Markets | Mark Dwelle | mark.dwelle@rbccm.com |
| JMP Securities | Matthew J. Carletti | mcarletti@jmpsecurities.com |
| Keefe Bruyette & Woods | Meyer Shields | mshields@kbw.com |
| Sandler O’Neill & Partners | Paul Newsome | pnewsome@sandleroneill.com |
| FBR Capital Markets & Co | Randy Binner | rbinner@fbr.com |
| Credit Suisse | Ryan Tunis | ryan.tunis@credit-suisse.com |
| Sterne Agee CRT | Vinay Misquith | vmisquith@sterneageecrt.com |
Primary Input Data
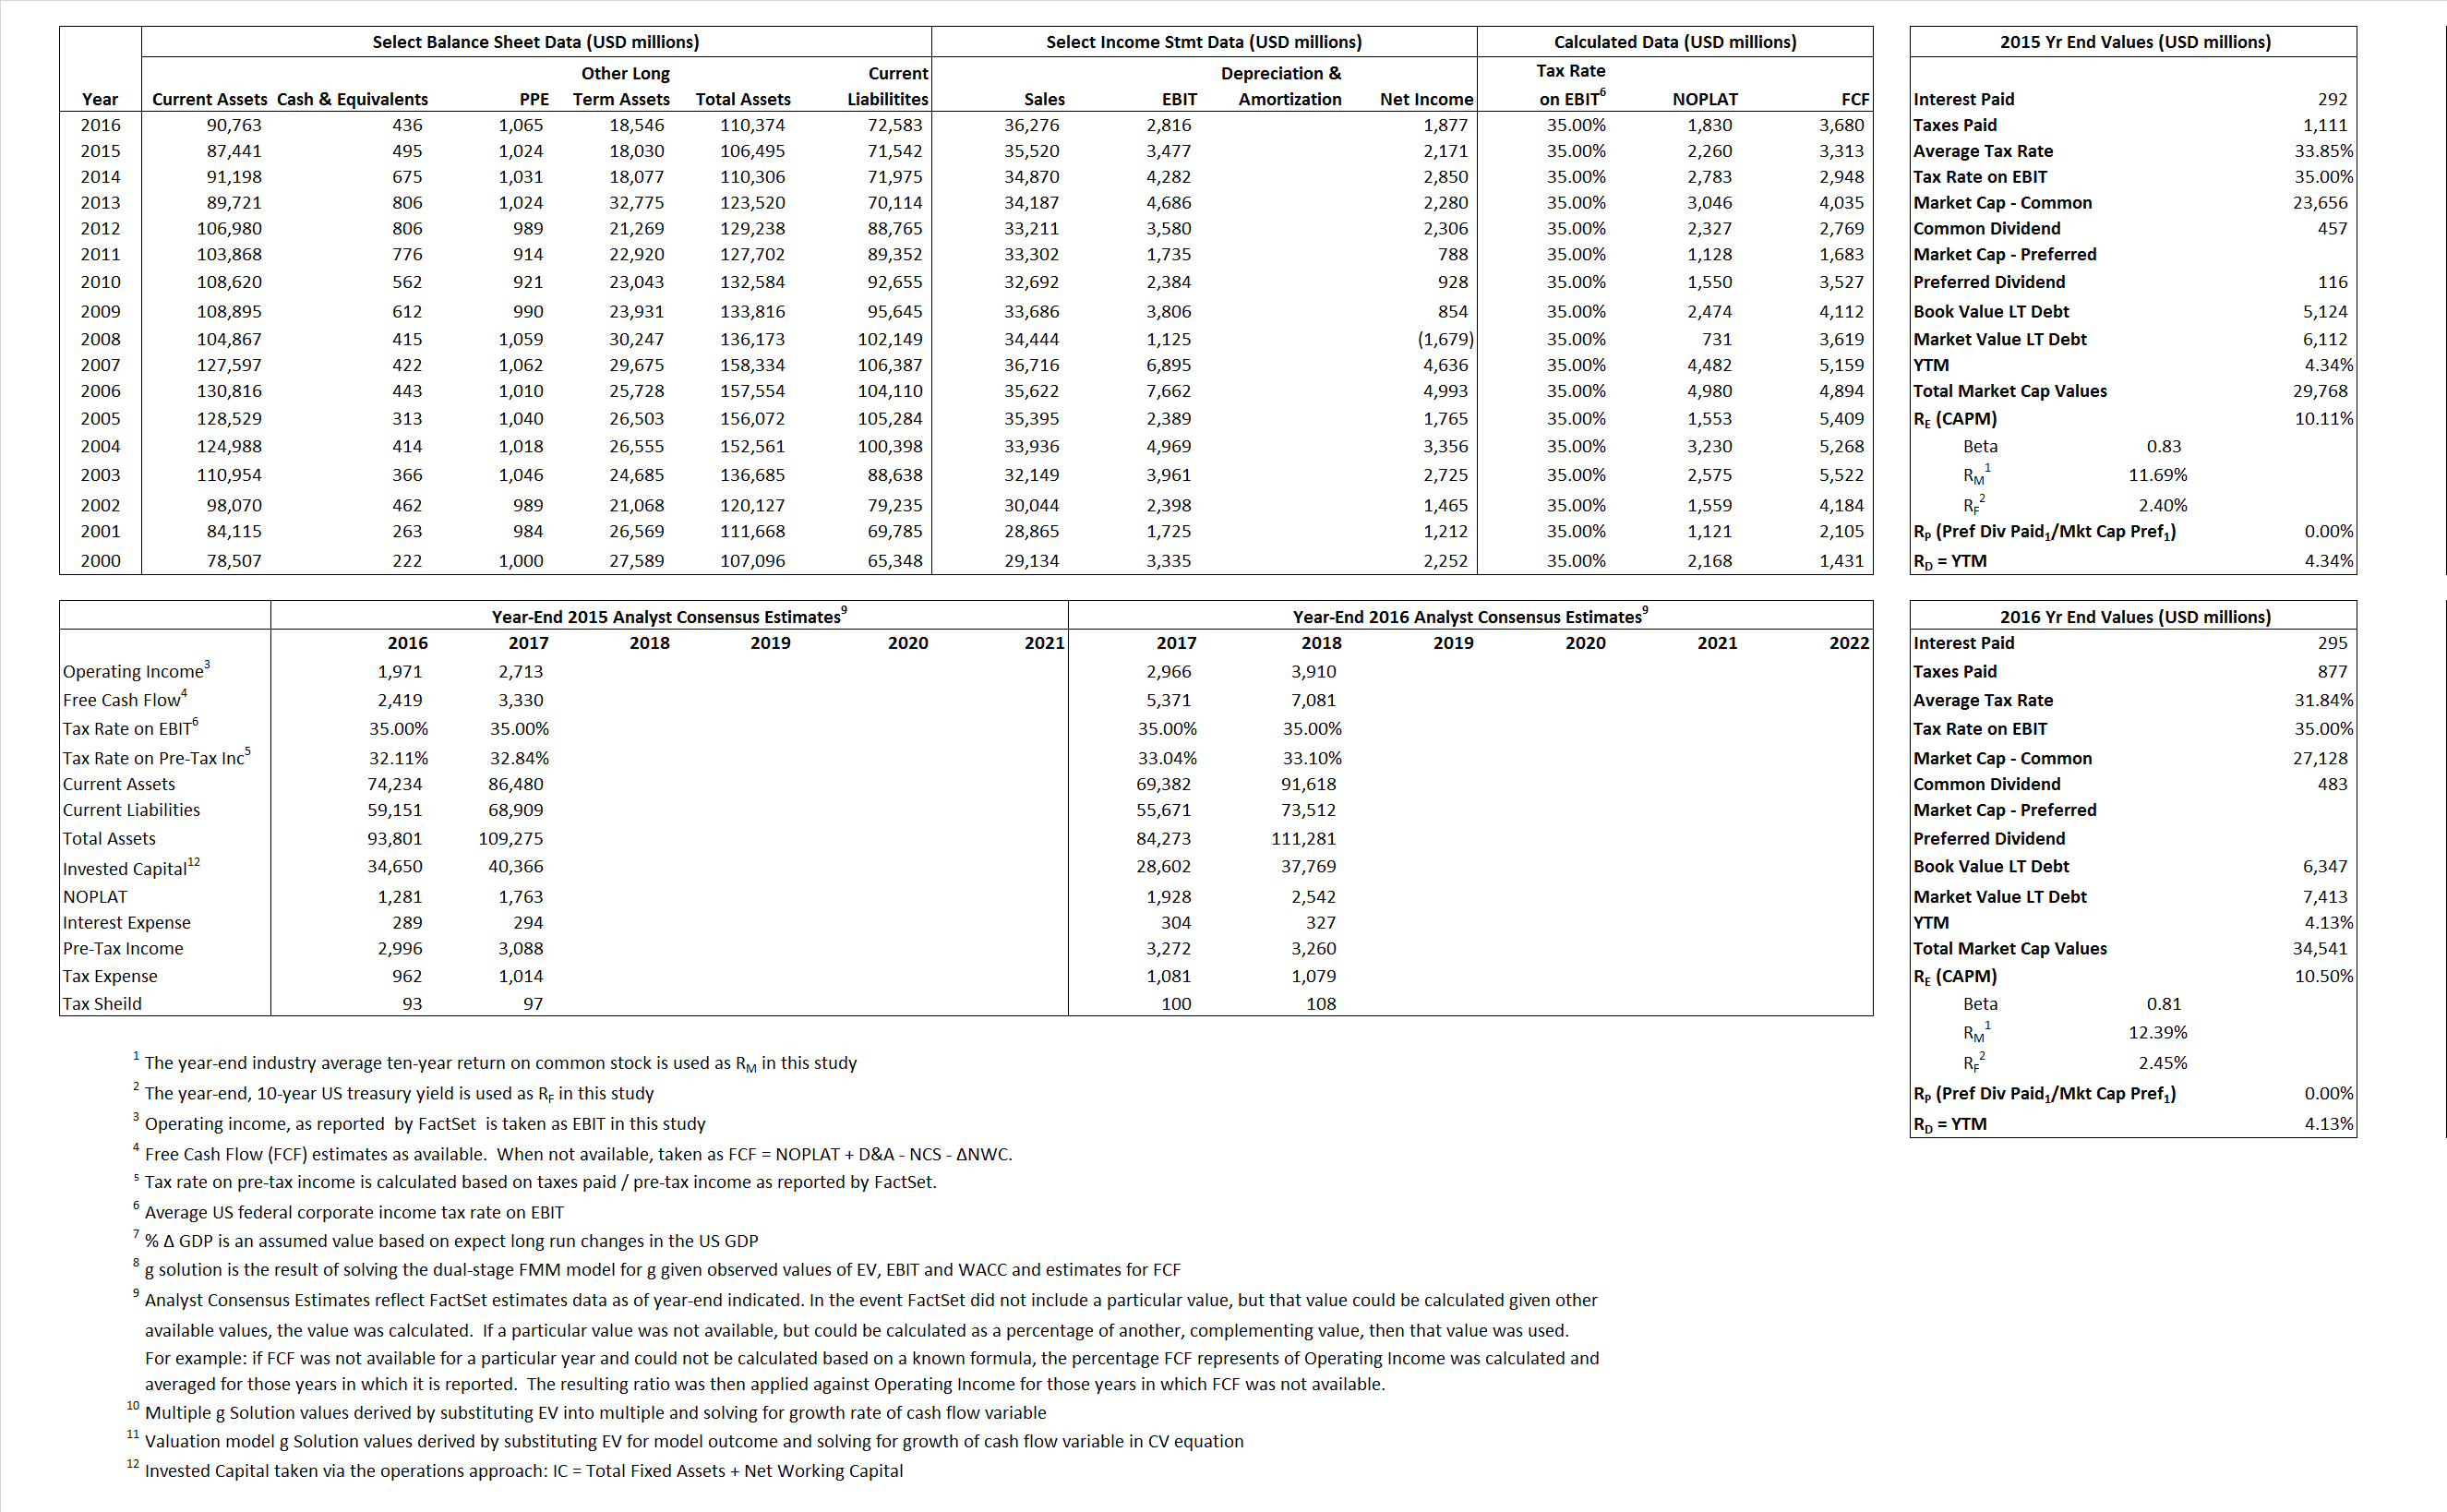
Derived Input Data
Derived Input |
Label |
2015 Value |
2016
|
Equational Form |
| Net Operating Profit Less Adjusted Taxes | NOPLAT | 2,260 | 1,830 |  |
| Free Cash Flow | FCF | 3,313 | 3,680 |  |
| Tax Shield | TS | 99 | 94 |  |
| Invested Capital | IC | 34,953 | 37,791 |  |
| Return on Invested Capital | ROIC | 6.47% | 4.84% |  |
| Net Investment | NetInv | (3,378) | 2,838 |  |
| Investment Rate | IR | -149.47% | 155.05% |  |
| Weighted Average Cost of Capital |
WACCMarket | 8.62% | 8.85% |  |
| WACCBook | 7.05% | 6.70% | ||
| Enterprise value |
EVMarket | 29,273 | 34,105 |  |
| EVBook | 28,285 | 33,039 | ||
| Long-Run Growth |
g = IR x ROIC |
-9.66% | 7.51% | Long-run growth rates of the income variable are used in the Continuing Value portion of the valuation models. |
g = %  GDP GDP |
2.50% | 2.50% | ||
| Margin from Operations | M | 9.79% | 7.76% |  |
| Depreciation/Amortization Rate | D | 0.00% | 0.00% |  |
Valuation Multiple Outcomes
The outcomes presented in this study are the result of original input data, derived data, and synthesized inputs.
Equational Form |
Observed Value |
Single-stagemultiple g solution |
Two-stage valuationmodel g solution |
|||
| 12/31/2015 | 12/31/2016 | 12/31/2015 | 12/31/2016 | 12/31/2015 | 12/31/2016 | |
|
|
.82 | .94 | -4.66% | -32.24% | -3.22% | 66.69% |
|
|
8.42 | 12.11 | -4.66% | -32.24% | -3.22% | 66.69% |
|
|
12.95 | 18.63 | -4.66% | -32.24% | -3.22% | 66.69% |
|
|
8.84 | 9.27 | -4.66% | -32.24% | -3.22% | 66.69% |
|
|
8.42 | 12.11 | -4.66% | -32.24% | -3.22% | 66.69% |
|
|
.84 | .90 | -4.66% | -32.24% | -3.22% | 66.69% |


